Indian Growth and Turkish Straits[1]*
With the growth of advanced economies slowing down, emerging markets have taken the role of spearheading the growth in global economic production. China and India in particular, making up 36% of the world’s population and accounting for 40% of the world’s annual GDP increase as of 2017, have become the engines of the world economy and this trend is set to increase in the upcoming decades. The rapid expansion foreseen for China and India will inevitably lead to an increase in demand for oil products and crude oil.
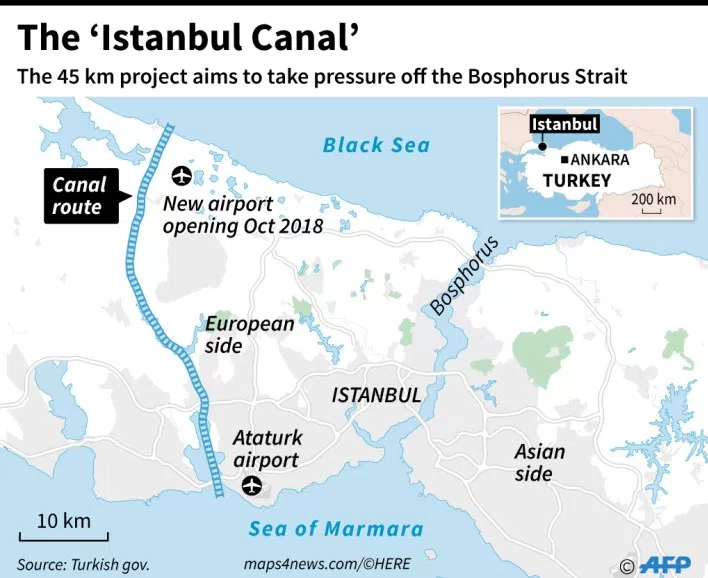
One of the chokepoints of global oil trade is the Bosphorus Strait. 38% of the maritime crude oil exports of Russia, the world’s largest oil producer, leave through its Novorossiysk port in the Black Sea. Almost all tankers departing from Novorossiysk have to pass the Bosphorus to reach their final destinations, and as is the case with all chokepoints, oil tankers have to wait due to maritime traffic. This situation creates significant costs to tanker operators and delays from a supply chain standpoint. The Kanal Istanbul project is strategically situated to ease this traffic. The goal of our study was to figure out how the increased import demand from China and India would affect the flow of oil tankers through Kanal Istanbul once it becomes operational, particularly considering the effects of climate change on Arctic trade routes.
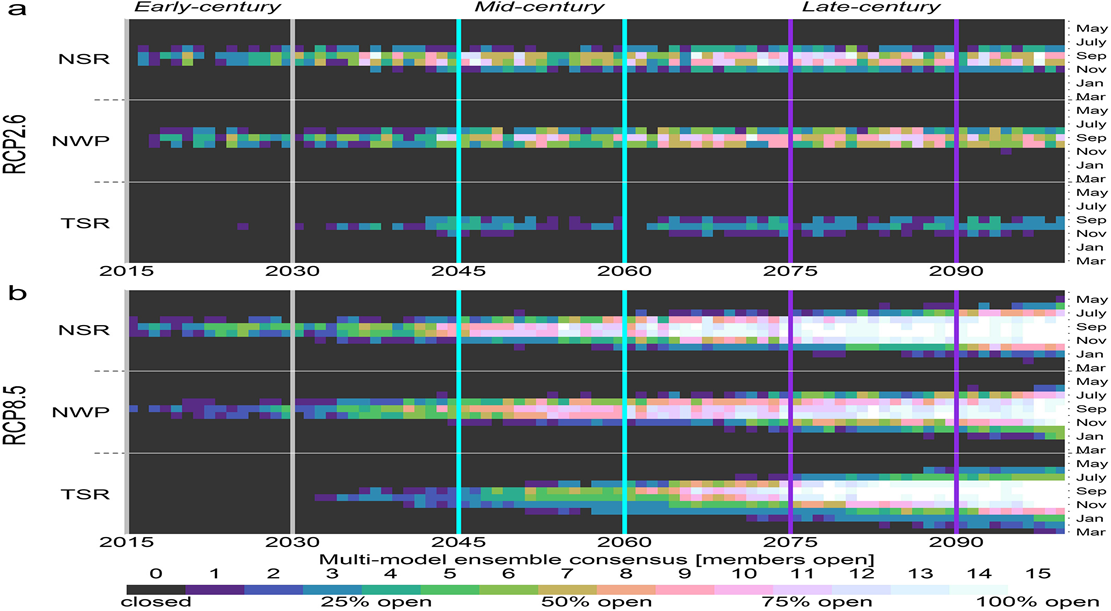
To figure out the effects of climate change we looked at climate models predicting polar ice over the long term. Since the Northern Sea Route doesn’t open up to a consistently navigable level until the late 21st century, it appears that the Arctic ice caps melting will have not have a significant effect on Kanal Istanbul by 2028, the year which is the basis of our analysis because it is when we may expect Kanal Istanbul to be fully operational.
Using data from Thomson Reuters Eikon, we analyzed oil flows outflows from Russia and inflows to India and China extensively by looking at all recorded tanker-level data between December 2014 and March 2018. We used historical annual economic growth and cumulative oil flow data to forecast China and India’s consumption and import demand in the year 2028. We found that China and India will respectively need to import 14.4 and 8.4 million barrels of oil per day (henceforth mmbpd) to satisfy the demands of their domestic industries.
Based on our research, we have found China’s location and needs render it to have little to no reason to import oil from Black Sea ports of Russia via the Turkish Straits. While Russia and China are currently energy trade partners, most of the crude oil trade between these two nations occurs through Russia’s Kozmino port in Siberia. Furthermore, China’s demand for medium crude oil can be satisfied from areas that do not require the passage of vessels from size constraining chokepoints, such as West Africa and the Middle East. As such, the oil trade between Russia and China is barely relevant for Kanal Istanbul’s purposes. Lastly, largely due to the demographic structures of China and India, India has already surpassed China as the world’s fastest growing economy, and will overtake it as the world’s largest country by population within the next decade, suggesting that India will be able to sustain its rapid growth for a longer period in comparison to China. For these reasons, the focus of this study is on India.
India imported 2.29% of it’s crude oil from Russia in 2017. This figure represents a significant increase from previous years, and can be expected to increase even more, as Russian and Indian enterprises have partnered on multiple different fronts in the oil industry. Most recently and notably, Rosneft, a Russian oil giant has bought a significant share of Essar Oil’s Vadinar Refinery second largest oil refinery in India, for a sum of 13 billion Dollars. Bilateral meetings and discussions at the governmental level indicate that this cooperation is expected to increase in the future
As of March 2018, all tankers carrying Russian crude oil to India have loaded exclusively from Novorossiysk port, implying that the Turkish straits have been used and that future Russian shipments can be expected to use Kanal Istanbul in the future.
With this information in mind, we made projections of the increase in oil flow through the Turkish Straits in the year 2028 for three different scenarios. The best case scenario assumes that Russian investments in oil refineries and related businesses will continue at full speed and projects that Russia will export an additional 0.405 mmbpd through Kanal Istanbul. The base scenario assumes that Indo-Russian collaboration will still be strong but the number of new Russian investments and ventures will be limited and thereby increase India’s imports from Russia by 0.295 mmbpd. In the downside scenario, the collaboration will either break down or having no effect, leading Russia to maintain its current market share of around 2.3%, translating into an additional 0.093 mmbpd. For reference, the average Suezmax tanker is capable of carrying 800,000 to 1,000,000 barrels.
When examined from a geographical perspective, it clear that using the Turkish straits is the optimal route to India, as using the Baltics or Artic would significantly lengthen the route and increase costs. The other alternative, Kozmino is irrelevant because it is more distant and the configuration of Indian refineries requires a significant amount of heavy and medium oil. Although a direct pipeline to India is theoretically possible, this is highly unfeasible due to the physical, financial and geopolitical challenges of such an undertaking. Thus in this study we find that the Black Sea to West India route will be utilized almost exclusively for Indo-Russian crude oil trade, and that tanker shipments from Russia to India will generate a substantial amount of traffic for Kanal Istanbul.
--
The remaining part of the report is for the supporting arguments of our basic conclusion, only for interested readers.
As we look at the table 2 in the appendix, almost 65 % of China’s crude oil consumption and almost 90% of India’s crude oil consumption are met by imports. (see also table 6) These two countries are the most rapidly increasing consumers of crude oil along with their growing GDPs. The Kanal Istanbul project could play a key role to connect these two countries with trading routes. The analyses of China and India which will be combined with an analysis of Kanal Istanbul in order to provide a clear picture of whether the project is feasible and what its future potential is, especially in light of developments such as the expected increase in the use of the Arctic as a trade route and The US’s recent export activities.
As Bloomberg shows, China surpassed the U.S. in annual gross crude oil imports in 2017 by importing 8.4 million barrels per day (b/d) compared with 7.9 million b/d of U.S. crude oil imports.
When table 1 is examined, in 2016, almost 59% of China's crude oil imports, and in 2017, 52% of it came from countries within OPEC. This decline can be explained by OPEC’s production decline. As the table explains, 2% decline from Saudi Arabia, 1% decline from Iraq, 1% decline from UAE are met with increase in US, UK and Brazil.
As for East-Siberia Pacific Ocean (ESPO)-1 Route 5; expansions in infrastructures will probably contribute to further increases in Chinese crude oil imports. In January 2018, China and Russia began operating an expansion of the ESPO pipeline, doubling its delivery capacity to approximately 0.6 million b/d. According to trade press reports, as much as 1.4 million b/d of new refinery capacity is planned to open in China by the end of 2019.
According to the table 9, most of crude oil suppliers of China, produce light crude oil with an average API of 38.1. The biggest supplier of China is Saudi Arabia with Arab Crude (32 API) which was 96% of its exports to China in 2017. The second is Arab Light (33.4 API) with 1.9% and the third is unspecified with 1.8% in Eikon. In 2018, all of its exports consist of Arab Crude so far.
The second biggest supplier of China is Angola with an average of 30.8 API, of which the grade with the highest API of 40.9 is Nemba, with a share share of 22% of total exports. The second is Saturno (27.6 API) with 15.5% and the third is Dalia(23.6 API) with 10.1% of total exports.
Iraq is the third biggest supplier with Basrah Light(29.7 API) which was 86,1% of its total exports and Basrah Heavy(23.7) which was 13,9% of its totals.
Iran is another major supplier with 55.6% of its exports being Iranian Light/Heavy(31.45 API), 17.9% Iranian Heavy(29,5 API), 7.15% Soroosh(19 API) and 6.16% Iranian Light(33.4 API). For further analysis see table 9
Oman is the fourth biggest supplier of China with Oman Export(34 API) making up 100% of its total exports.
Russia’s exports to China is mostly come from ESPO Blend(35,6 API) with 88,3% of its total exports in 2017. Sakhalin Blend(45,5 API) and Urals(31,5) are second and third with 6,4% and 4,8% of total. In 2018, 94,1% of its total comes from ESPO Blend so far.(for further analysis see table 9, Russia 2018)
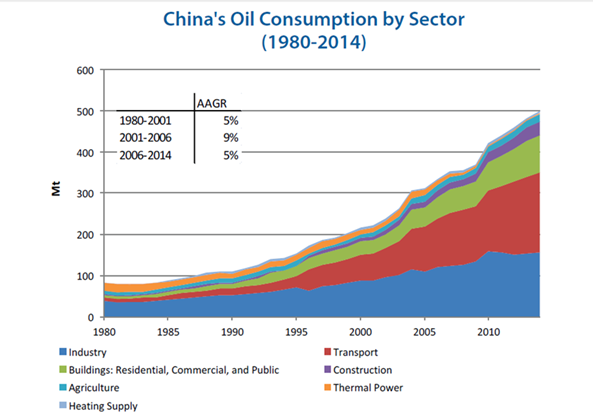
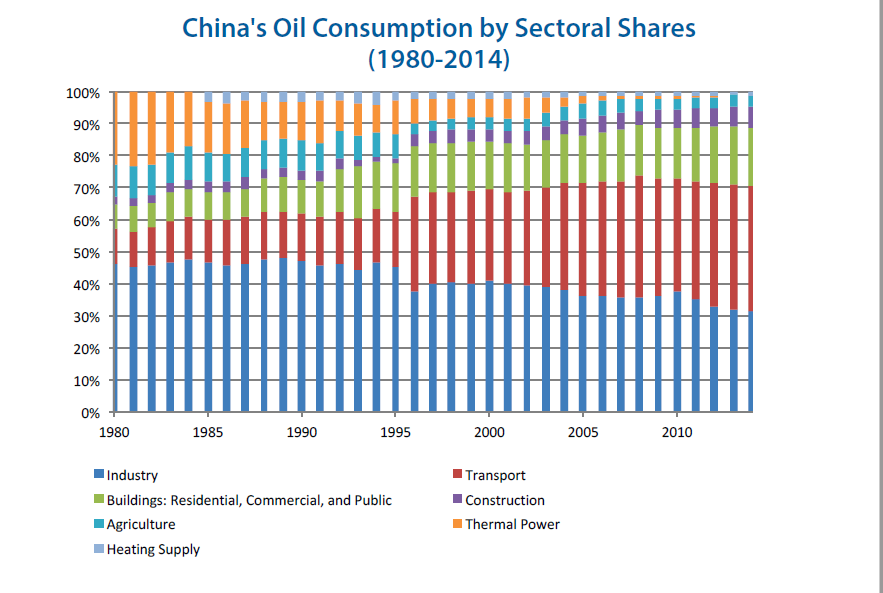
According to chart 1 and chart 5 oil consumption mostly consists of Industry and Transportation. Over the last years share of transportation in overall oil consumption increased rapidly as total vehicles sales increased on the average of 5% per year.
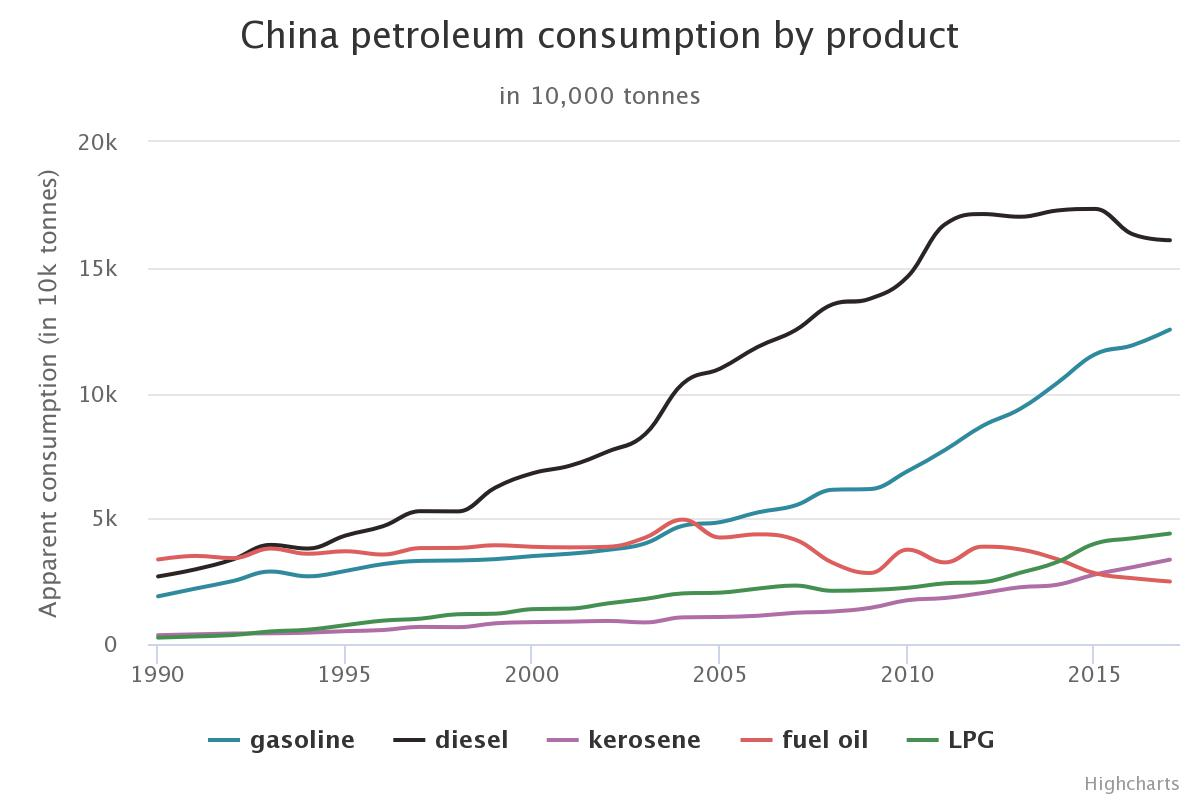
China’s oil demand may be increasing, however as we examine outputs by product, consumption of diesel fuel and its growth in usage is declining. Our speculation for the reasons behind this is that air pollution caused by diesel transportation where local governments looking for cleaner and more efficient alternative types of transport, new trends for the efficiency and energy through industrial upgrade and economic transition towards service-oriented sector.
Our prediction here is that while the oil demand increases owing to increase in respectively transportation and industry, usage of gasoline will increase on the share compared to diesel fuel.
India has a rather diverse set of imported oil grades as seen in table 10. In 2017 Arab Crude constituted the greatest share with 17.64% with Basrah Light and Iranian Light/Heavy coming in at a distant second and third.
Nearly half of the crude oil exported from Russia is Ural Grade with CPC and ESPO blends also constituting significant portions.
The Ural blend tends to be a mix of heavy sour crudes from the Urals-Volga region and light sweet crudes from West Siberia. Since Russia produces oil that is heavy and light as well as sweet and sour, it can be said that blends can be constructed to accommodate the needs of importers.
Russia has been expanding Novorossiysk Port in the Black Sea since 2016. Even though the port’s volume is low relative to the aggregate imports of India and China, it carries importance for the future of the Kanal Istanbul. The general claim is that, the reason behind the expansion is to better compete with Ukraine’s largest ports. However, as closely examined Russian oil grades, alternative arguments can be raised as the real reason of expansion is to blend Urals crudes with some other light crude oils and transfer through Novorossiysk port, or meet expanding Indian demands.
India is the third-largest consumer of crude oil in the world. India, which imports about 90 percent of its oil demand, has emerged as a key driver for growth in global oil demand.
India is set to surpass China as the fastest-growing oil products market in Asia, with fuel demand growing by 6.1 percent in 2018. FGE(Facts Global Energy) expects India's fuel demand to rise by about 4.5 percent this year to 4.2 million bpd and by 5.1-5.2 percent in 2018. India is increasing its refining capacity to keep up with the expected growth in fuel demand.
Recent data shows that India’s crude oil production decreased over the years. However, its consumption would be the key driver in the crude oil market along with China, despite its production have been decreasing, its imports have been increasing significantly.
According to the International Energy Agency’s special report on India (2015), under the new policies assumptions, India’s oil demand is expected to rise to 7.0 mmbpd. The distribution of demand for oil products is as shown in Table 12. More recent reports from the Indian government indicate that the IEA’s report grossly underestimated the increase in demand, as India has plans to raise refinery intake capacity to 8.8 million barrels per day, in contrast to the IEA’s projection of 5.8 million. Our projections for India’s demand for oil products are predicated upon the percentage distributions of IEA’s report and adjusted with respect to the recent announcements of the Indian government.
As it can be seen from Table 12, transportation fuels such as diesel, LPG and motor gasoline form a significant portion of India’s oil product demand. As it currently stands Given these needs and the fact that India is not expected to increase its domestic crude production materially, it can be said that India will be demanding a significant amount of light crude oil in the near future. For reference, India’s 2017 oil imports’ average API is 30.81, which is roughly equivalent of Arab Medium grade. For the purposes of our analysis, Russia’s exports Ural and Sakhalin grade crude have API gravities of and 31.69 and 32.34 respectively, indicating that they would slightly lighten the average of India’s imports without requiring a significant change in refinery configurations.
Middle East region(Iraq, Iran, UAE, Saudi Arabia) continued to be the largest source of crude oil imports at 62.5% followed by Africa at 16.4 percent and South America at 11.7 per cent according to Table 6. Although the Middle East has long been responsible for most of India’s imports, the share of the Middle East has been decreasing as a result of OPEC’s production decline in the latter part of 2016 as can be seen in Table 6. After these decline, the share of imports sourced from non-OPEC oil exporters indicating that India compensated for the production decline with these nations such as Brazil, Russia, Oman, Mexico etc.
Russia and India have had a long history of collaboration in the energy industry. This relationship reached a new height in August 2017 when Rosneft announced it would buy a 98% stake in Essar Oil for 13 billion dollars. Essar Oil operates the Essar refinery, which is the second largest refinery in India, processing 405000 barrels per day.
The Russian port of of Novorossiysk is currently the only loading point for Russian exports to India. This is most likely due to the fact that Novorossiyk is substantially closer to India’s west coast than Russia Baltic and Siberian ports, and because the Indian refineries of Essar and Jamnagar opt for cheaper and heavier oil grades and mixes. There have not been any indication from the refineries that they would reconfigure for lighter mixes in the future, thus we can deduce that the Baltic, Arctic and Siberian ports are not a threat for Novorossiysk and that Russia will continue loading 100% of its exports from their Black Sea port, making use of the Turkish straits.
With this information taken into consideration, we came up with three different scenarios to project Russia’s oil exports to India. These projections are all based on our GDP-oil regression model (table 2), which itself relies on World Bank projections and past crude oil trading data.
We came up with three different scenarios, the assumptions and results of which are shown in Table 19.
Impact of Various Scenarios on Bosphorus and Kanal Istanbul
Since all crude import of India from Russia export from Novossiysk port all of the trade will pass trough the Turkish straits. The travel times through Turkish scenarios according to our models are:
In good scenario:
1 suezmax in 2.22 days and 1 VLCC in 4.94 days
In base scenario:
1 suezmax in 3.05 days and 1 VLCC in 6.79 days
In bad scenario:
1 Suezmax in 9.73 days and 1 VLCC in 21.62 days
India’s import dependence on crude oil increased over the years as shown in table 2 . For more recent analysis; %83.2 in September 2017 as compared to %82.4 in the corresponding month a year ago. Cumulatively, import dependence in the first six months increased to %82.3 as compared to %81.9 in the same period a year ago.[2]
As seen in Table 2, China and India have both exhibited growth in GDP that has been among the highest in the world. While these rates have decreased, they are projected to remain comparatively high compared to the developed world. Given the massive populations and industries of these nations, this growth translates into a substantial increase in oil demand in the upcoming decades.
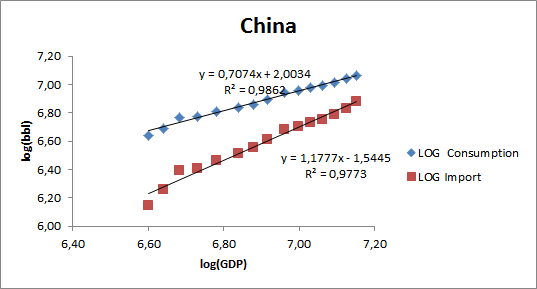
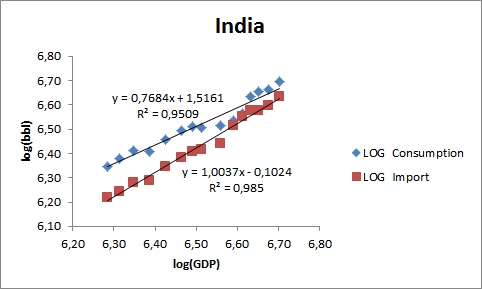
Using macroeconomic and trade data going back between 2002-2016 from JODI and Eikon as well as long term projections from OECD, we made an attempt to forecast China and India’s import volume in 2028, 5 years after Kanal Istanbul becomes operational. Using a log-log regression model, we found that there is a strong positive relationship between the percentage increase in real GDP and the percentage increase in crude oil consumption and import volume for both China and India.
Graph 2 illustrates how GDP has historically related with oil demand in China. The regression shows that for every one percent increase in GDP translates into a 1.17 % (± 0.05 %) increase in crude oil imports.
Similarly, Graph 3 shows that every 1% increase in India’s GDP, led to a 1.003% (± 0.034 %) increase in oil imports.
Notably, the trendlines for imports are steeper than those of consumption for both nations. This indicates that the import volume is outpacing consumption volume or in other words, China and India are both becoming more dependent on foreign sources to supply their crude oil demand.
Using these regressions to project demand out to the year 2028, in 10 year’s time, China and India’s import volumes are forecasted to stand at 14.4 and 8.4 million bbl/day, respectively as shown in Table 2.
From 2015 onwards, Russia’s crude exports have grown at an annualized rate of around 8% in terms of volume(see total exports), although its production has remained comparatively stagnant, only growing 1% - 2% per year.
China comprises around 10% of Russia’s seaborne exports, making it Russia’s third biggest maritime crude oil trade partner after Italy and The Netherlands. In addition to maritime trade, these two countries have the ESPO pipeline which facilitates crude oil trade.
Up until recently, India had nearly no imports at all from Russia, although this has changed starting in 2016. In 2017, India made up 2.52% of Russia’s exports, showing an increase on a monthly basis within 2017, indicating that Russia and India are actively increasing their bilateral trade volume.
The total projected compounded annual growth rate of India and China’s crude oil imports up to 2028 is around 5.6% (total of 74%). This indicates that if Russia manages to keep increasing its exports at the rate that it has over the past 3 years, it should be more than enough to maintain its significance China and India’s demand, and Russia’s share in the crude imports of these nations would increase. However, given Russia’s historical production ranges and its forecast, it is doubtful whether or not Russia can sustain such a growth in exports, especially as exports begin to comprise an increasingly greater share of Russian oil production.
As table 14 indicates, the overall tendency is for exports to take place from the port which provides the easiest and shortest route to the discharge country.
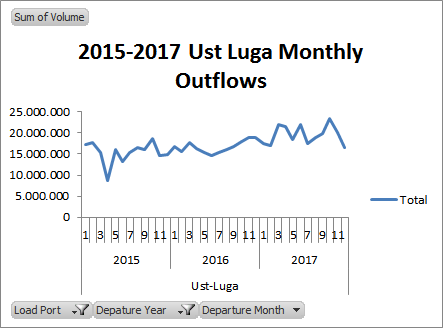
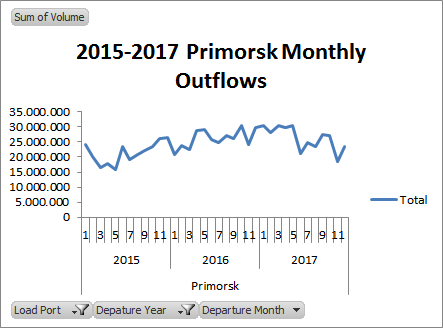
Although it is known that Baltic ports, which have a collective capacity of over 4 million barrels per day, freeze for up to 6 months every year, our data set does not show any significant seasonal changes in tanker volume in any of the ports, as shown in Charts 7-10. It is also worth noting that contrary to what one may expect, Russia’s Siberian and Arctic ports do not freeze over during the winter, as ice accumulation is not just dependent on temperature but also water depth. Even with Baltic ports freezing, Russia is able to keep maritime traffic flowing through the use of icebreakers, which it funds by imposing a “winter surcharge” on vessels. While this makes exporting through the Baltic Ports more expensive in the winter, it still remains possible to use these ports.
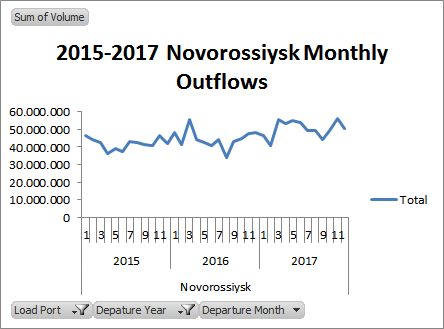
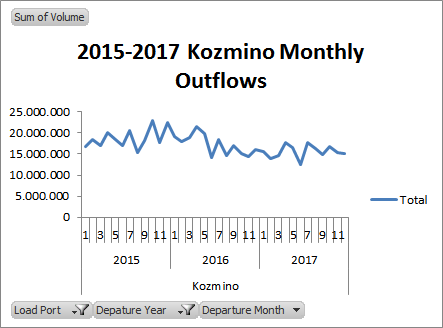
Table 13 shows us the ports of origin for the two major importers analyzed in this study. Looking at maritime exports to China and India in particular, we see that since 2015 Russia has sent crude oil to India exclusively through the Novorossiysk port in the Black Sea. In contrast, the overwhelming majority of Chinese exports occur through Russia’s Siberian ports.
The fact that crude oil flows through the Turkish were substantially higher in the past seems to indicate that Novorossiysk port has the necessary capacity to increase its output. The possibility of increased outflows from Novorossiysk is further supported by a 500 million dollar port deepening project, commissioned by the Russian government in 2015 and expected to be finished in 2020. An increase in crude outflow would be the ideal scenario for the Kanal Istanbul project, as the Turkish straits are Novorossiysk’s sole gateway to the world’s seas.
Listed in Table 21 are the distances between Chinese and Russian ports which account for 70% of the crude oil trade between Russia and China.
Due to the scope of our research we only considered shipments of crude oil originating from the Black Sea port of Novorossiysk and the Siberian port of Kozmino from December 2014 to March 2017. we then filtered out the tanker data to only include entries which
For tankers departing from Novorossiysk (n=5) we found that the average travel time was 41.01 days. The average freight price per day on this route was 3.72 million dollars. Using these numbers, we were able to yield a per day per barrel price of 9.16 cents Due to inconsistency in the data entry formats, we were unable to differentiate between individual Chinese ports in our analysis.
Using the same methodology we found a sample of n=229 tankers from Kozmino to China. We found that the average travel time was 10.14 days and the daily tanker cost was 66602 dollars. The average price per barrel came out as 90.7 cents, which leads to a per day per barrel cost of 10.97 cents, a 19.5% premium over it’s Novorossiyskian counterpart.
It may also be worth noting that shipments originating from Kozmino are noticably smaller, with the average volume being 623000 barrels in contrast to Novorossiysk’s 1.013 million.
Although shipping from Novorossiysk is more efficient i.e: cheaper on a per barrel per day basis, the significance of Kanal Istanbul is a function of per barrel freight charges. Shipping crude oil from Novorossiysk to China costed an average of 3.68 dollars per barrel, in comparison to 0.91 cents. This finding carries the implication that for it to be worthwhile to make use of, Ural blends must carry a value premium of 2.76 cents over ESPO/Sakhalin oil.
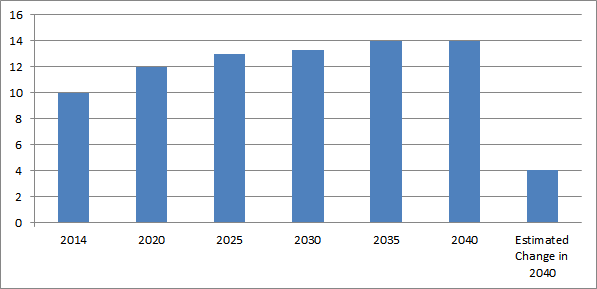
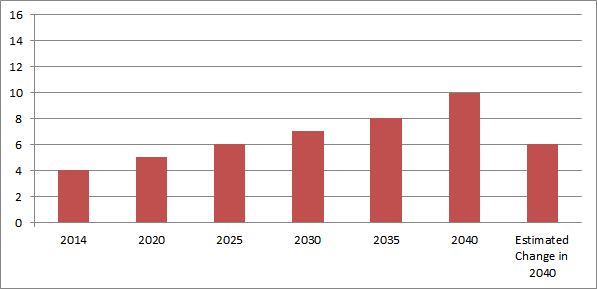
According to IEA data, in 2030, expected demand from China is 13 mmbpd. This number rises to 14 mmbpd in 2040 and estimated change from now to 2040 is 4 mmbpd. For India, the expectation in 2030 is 7 mmbpd and 10 mmbpd in 2040. The total estimated change relative to the present day is 6 mmbpd.
OPEC’s World Oil Outlook 2040(page 128) examined, Russia’s crude production is around 10.5 mmbpd and the expected change in 5 years is a 5% increase. As figure 6.7 states(page 186), crude oil exports from Russia to Asia-Pacific region increase until 2040. Furthermore, figure 6.2 and 6.3 indicates significant increase in supply of crude oil from Middle East and Russia. thus expectation from figures 6.5, 6.7 and 6.12 says that most of them is to meet Asia-Pacific increasing demand which is mostly China and India.(pages 184-186-191) Lastly, estimation of China’s net crude imports are around 10 mmbpd in 2020 and around 12 mmbpd in 2040, as the figure 6.13 states.(page 192)
Our expectation for India’s consumption in 2030 7.8 mmbpd which is consistent with other sources, however our expectation for China’s consumption is higher with 17 mmbpd compared to 13 mmbpd and imports are higher with 14 mmbpd compared to 12 mmbpd. Russian production forecast is mentioned above. Russian production forecasts are consistent with our forecast.
The assumptions of every model aiming to predict oil consumption and imports into the future vary considerably.
Our GDP Regression
Our model makes the assumption that crude oil import and consumption are log-linear functions of real GDP. Thus to project China and India’s future oil needs, we used OECD’s past data to run a regression and generate future expectations for China and India’s crude oil consumption and imports. Implicitly, our model makes assumptions such as:
OECD (2017)
By comparison, OPEC in their World Oil Outlook report (2017) makes these assumptions:
BP (2018)
BP also makes projections, albeit only to the year 2035, with no intermediate years. In doing so, it states that it also makes assumptions such as:
Besides these BP doesn’t release significant information regarding it’s oil-specific forecasting methodology
IEA
In 2015, the IEA published an India-specific special report, in precedence of the country’s accession into the agency in 2017.
In this report the IEA drew particular attention potential future policy changes up until 2050 and used a “New Policies Scenario” making assumptions such as:
Being more extensive than previous reports, the IEA’s 2015 India Special report is by far the most intricate and perhaps accurate (given its assumptions hold true).
The IEA has also projections per China, although they do not take into account as many country-specific policy variables. In it’s 2017 “Analysis and Forecasts to 2022” report”, the IEA reveals it makes the assumption that Chinese oil demand increase will slow down to 2.4% from 4.8% in the previous 5 years.
EIA
Although it does not specify the details of it’s methodology for international projections, (see section on EIA’s domestic oil forecasting methodology), international projections are an extension of the EIA’s dynamic system, which provides estimations with the options of low and high economic growth and oil prices.
In the reference case, the GDP growth assumptions for China and India are 3.7 and 4.3 % respectively.
Russia has two means of supplying crude oil to China: by sea and through the ESPO pipeline. According to reports by Xinhua, China’s official news agency, ESPO is capable of carrying 15 million tons per year. Using the average ton to barrel conversion factor of Russia to China exports (7.38), this equates to 110.7 million barrels per year, or slightly over 300000 barrels per day. Since there is a constant flow from Kozmino to China, it can also be said that the segment of the ESPO pipeline diverging into Daqing, China is operating at full capacity.
In the 12 months between March 2017 to March 2018, the routes of Russia to China oil flows can be listed as in table 23:
Metrics of Turkish Straits/Canal | |||
| |||
Length | 45 km | 30km | 61km |
Width | 250-1000 meter | 750 meter to 3.7km | 1.2 to 6.5 km |
Depth | 25 meter | 36.5-124 meter | in avarage 55 up to 90 meter |
Kanal Istanbul | Turkish Straits |
|
|
The time for ships passing through the Kanal Istanbul will be lower than the Bosphorus. When we consider passage time of ships through the Kanal Istanbul we must consider that length of the Kanal Istanbul is 1.5 times that of the Bosphorus. We also know from observing maritime traffic that the average speed in the Turkish straits is 8 knots and in Kanal Istanbul the average speed must be at least 9 because in Suez the average speed is 9 knots, despite it being narrower than Kanal Istanbul and similar in terms of lack of traffic. This difference in the speed between Bosphorus and canals is primarily because of the low traffic in Kanal Istanbul. It is expected to be much lower than the Bosphorus, because in the Bosphorus there are many factors which can create traffic other than shipping. For instance ferries, tour boats and flybridges. Considering this increase in the speed of tankers, a tanker can pass the Bosphorus in approximately 2 hours and Kanal Istanbul in 2 hour 40 minute. President Recep Tayyip Erdogan publicly stated that “the waiting costs of the ships will decrease by 1.4 billion dollars annually” we can assume that there will be substantial decrease in the waiting time of the ships outweigh this 40 minute difference in the passing time.
Daily avarage waiting time in the Turkish Straits in 2017:
Dardanelles North Gate: 2.46 days
Dardanelles South Gate: 2.44 days
Bosphorus North Gate: 1.57 days
Bosphorus South Gate: 1.36 days
What are major crude oil trade routes in the world?[3]
Although there is no universal definition as to what constitutes to a major The Baltic Dirty Tanker Index published by The Baltic Exchange lists 21 trade routes (see Appendix) and in its 2014 edition of The Baltic Code, each of which sees a significant amount of oil flow. Using tanker data from sources such as Lloyd’s Intelligence List, Eikon and the most notable of these trade routes can be approximated as:
What determines crude oil trade routes?
Although the market for crude oil was historically dominated by producers, the dynamics of trade route determination have shifted towards the demand side in recent years. The increasing number of oil producers as well as the rise of crude oil demand in developing nations has led to the creation of new routes and an increase in volume in existing routes.
International political dynamics also play a role in determining the significance of trade routes. In 1973, OPEC issued an oil embargo on the US. This and similar occurrences have the power to change from whom importers purchase oil, and therefore the routes themselves.
Besides these factors, the trade policies of countries also have the potential to affect trade routes. An example of this was the ban on crude oil exports that was in effect in the United States up until 2015, which was put into place to ensure self-sufficiency following the aforementioned embargo. Naturally, this resulted in a lack of export routes for the US for a period upwards of 40 years.
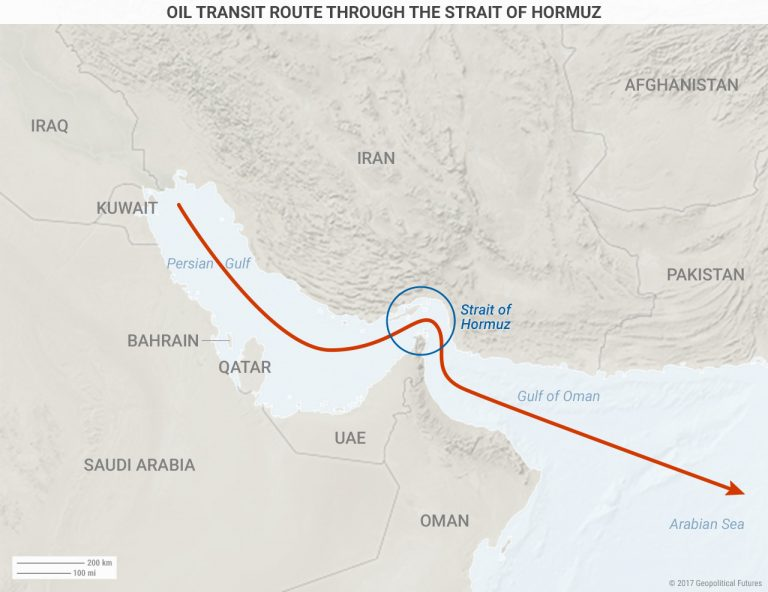
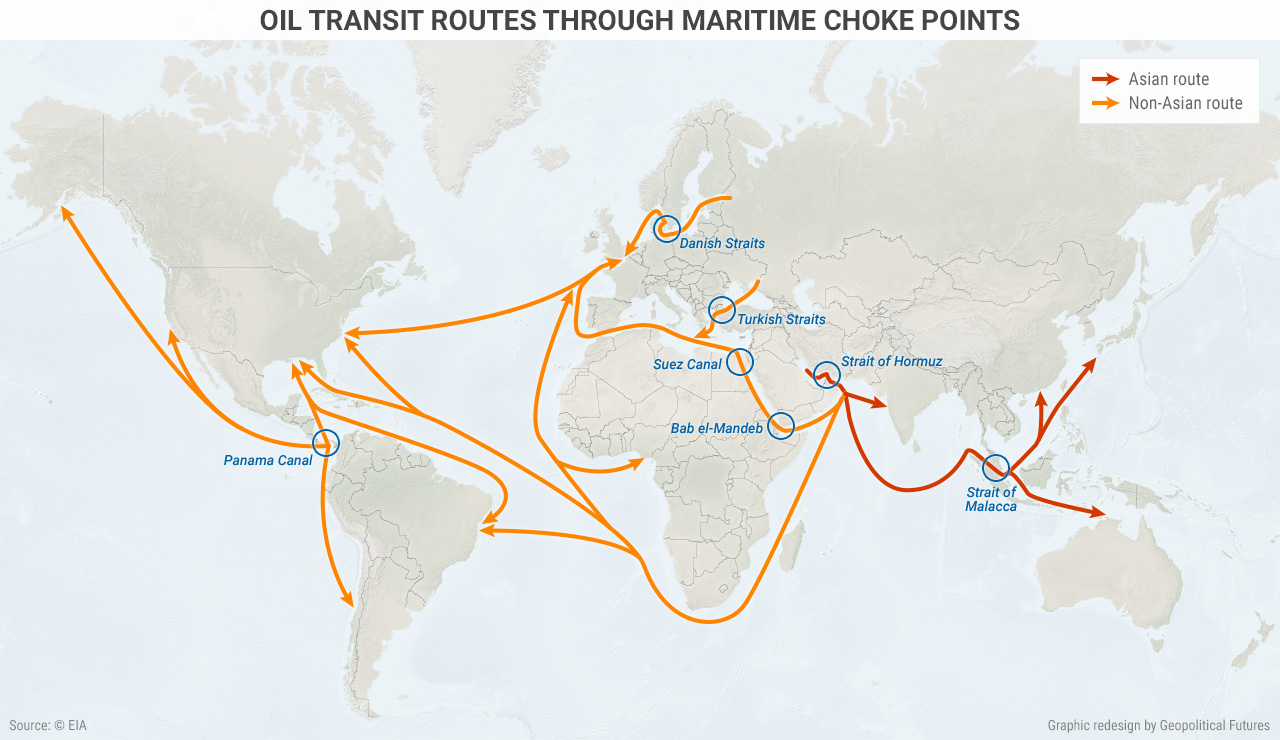
Strait of Hormuz (19.1 mmbpd)
Located between Oman and Iran, the Strait of Hormuz connects the Persian Gulf with the Gulf of Oman and the Arabian Sea. The Strait of Hormuz is the world's most important oil chokepoint because it provides some of the leading oil producers access to global trade routes.At its narrowest point, the Strait of Hormuz is 21 miles wide, but the width of the shipping lane in either direction is only two miles wide, separated by a two-mile buffer zone. The Strait of Hormuz is deep enough and wide enough to handle the world's largest crude oil tankers, with about two-thirds of oil shipments carried by tankers in excess of 150,000 deadweight tons coming through this Strait.
The countries that have ports within the Persian Gulf include Kuwait, Bahrain, Qatar, Iraq, Iran and Saudi Arabia. In the 12 month period between March 2017 and February 2018, these countries saw crude oil outflows amounting to 7.166 billion bbl. This is equivalent to 19.6 million bbl/day.
In the same period, these countries also had discharges of 338.6 million bbl (927 thousand bbl/day) in their ports. It is worth noting that oil flows within the Gulf summed up to 301.5 million bbl. To find the total flow of crude oil through we need to add up the inflow and the outflow, and subtract the intra-gulf trade volume twice to account for the double counting in the sum. All in all, the Hormuz sees 18.9 million bbl/day in tanker traffic.
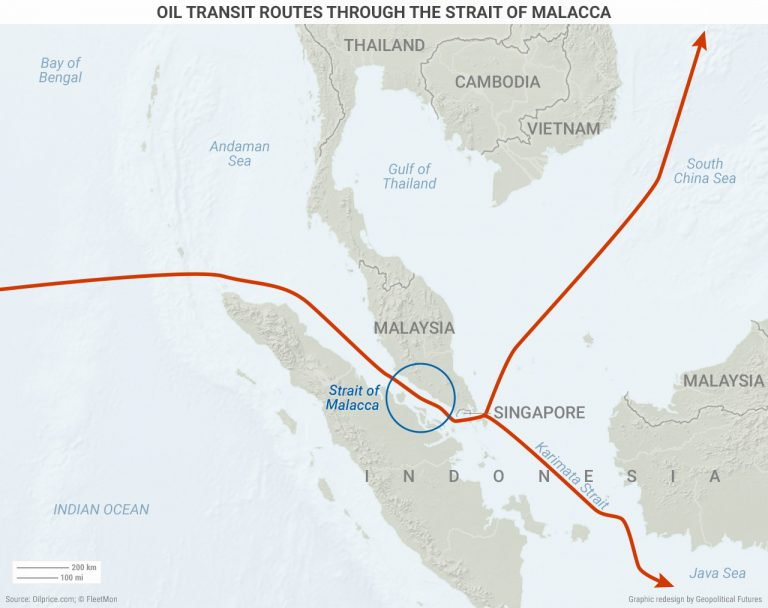
Strait of Malacca (14.3 mmbpd)
The Strait of Malacca, linking the Indian Ocean and the Pacific Ocean, is the shortest sea route between the Middle East and growing Asian markets.At its narrowest point in the Phillips Channel of the Singapore Strait, the Strait of Malacca is only about 1.7 miles wide, creating a natural bottleneck with the potential for collisions, grounding, or oil spills.[4]
If the Strait of Malacca were blocked, nearly half of the world's fleet would be required to reroute around the Indonesian archipelago, such as through the Lombok Strait between the Indonesian islands of Bali and Lombok, or through the Sunda Strait between Java and Sumatra.[5] Rerouting would tie up global shipping capacity, add to shipping costs, and potentially affect energy prices.
World oil chokepoints can be defined as narrow passages within high traffic global trade routes in which natural or artificial restrictions prevent the constant flow of large seacraft. These points are critical in the scope of global markets, as delays due to events such as conflicts, weather disturbances and have the potential to significantly disrupt markets.
Using geographical positions to approximate trade routes, the Eastbound flow in the Malacca Strait, as defined as flows from West Africa, Europe and the Middle East to North and Southeast Asia was 5.217 billion bbl (14.3 million bbl/day) between March 2017 and 2018. The Westbound flow was comparatively negligible at only around 10000 barrels per day.
Suez (5.5 mmbpd)
Man-made Canal connecting the Red Sea to the Mediterranean Sea. Currently the permissible limits for suezmax ships are 20.1 m (66 ft) of draught with the beam no wider than 50 m, or 12.2 m of draught with maximum allowed beam of 77.5 m. These restrictions generally allow vessels with DWT weights under 200,000.
Around 75% of the oil tanker traffic in the Suez Canal is northbound, with exports of Gulf nations heading towards Europe and North America making up 84% of Northbound traffic.
Bab El-Mandab (4.8 mmbpd)
Connects the Red Sea to the Indian Ocean via the Gulf of Aden. Oil traffic has shown an increase of nearly 50% over the past few years, with Northbound vessels comprising 60% of oil flows. Piracy in the Gulf of Aden has been a non-negligible issue for trade ships in the Bab El-Mandab Strait.
Danish Straits (1.4 mmbpd)
The Danish Straits are Russia’s access point to the Atlantic Ocean and Western Europe.
Turkish Straits (1.73 mmbpd)
Provide an access point for Russia into Meditteranean Sea. Among the most difficult straits to navigate. Although the Dardenelles and Bosporous were chokepoints for approximately 3.4 mmbpd at their peak in 2011, this figure has fallen substantially in recent years with Russia opting to ship its exports through the Baltic Sea.
Panama Canal(0.9 mmbpd)
Although the Panama Canal connects the two largest bodies of water in the world, it is a comparatively less significant chokepoint than those previously mentioned. Being only 33.5 meters at the narrowest point, the Panama Canal is more restrictive than other chokepoints and can only accommodate vessels up to “NeoPanamax” dimensions which have a capacity of up to 600000 bbl.
Oil and Energy Forecasting Methodology
Though mostly opaque in their methodology, some energy related institutions give us insight on how oil supply and demand can be projected years into the future. The Energy Information Administration (EIA) of the US is one such example of these institutions. EIA publishes annual energy outlook reports with models estimating future oil prices, supplies and demand through an integrated system called the National Energy Modeling System. This system models numerous energy related parameters of the United States and includes interactions with global energy markets.
As with all models, the EIA’s models makes a set of fundamental assumptions and comes up with not a single figure, but results for conservative, average and high assumptions. Listed below are the assumptions made for oil markets:
• Reference case:
– Considers improvements in known technologies
– Current views in economic and demographic trend – Current laws and regulations remain unchanged
• High and Low Economic Growth cases:
– High case assumes compound annual growth rates for U.S. gross domestic product of 2.6%
– Reference case 2.0%
– Low case assumes 1.5%
• High and Low Oil and Gas Resource and Technology cases: – High case - more accessible resources and lower extraction technology costs than in the Reference case – Low case - fewer accessible resources and higher extraction technology costs than the Reference case
• High and Low Oil Price cases:
Brent crude prices by 2050 in 2017 dollars:
– $229 per barrel in the High Oil Price case
– $114/b in the Reference case
– $52/b in the Low Oil Price case
Why can’t US oil be a substitute for Saudi Arabian oil?[6]
Density is one of the benchmarks used to classify oil. High density crude oil with a low API gravity value (less than 28 degrees) is considered heavy, while less dense oil (API gravity over 33 degrees) is classified as light and oil in between these two in terms of viscosity is medium. This classification criteria (along with others such as sulphur content) is the underlying reason behind why all of the petroleum produced in the world is not traded as a single homogenous commodity, but instead divided into grades such as Brent, Dubai and WTI.
Upon being shipped to refineries, crude oil goes through a refining process in order to generate more valuable petroleum products such as gasoline, bitumen or jet fuel. Depending on the demand for specific petroleum products in the market to which they sell their output, oil refineries have configurations which allow them to produce a high yield of petroleum derivatives using only certain grades (or blends) of oil. Using alternative oil grades with different physical characteristics would lower the yield and hence the revenue of refineries.
Crude oil from the US including shale oil, which has been responsible for the boom in US oil production, is mostly light and sweet. In contrast, oil from Gulf nations like Saudi Arabia tends to be sour and medium-density. In order for US oil to be a substitute for Saudi oil, refineries that import crude oil from Saudi Arabia would have to undergo costly changes to their operational processes which would not be economically viable under regular market conditions.
What could be the main reason Russia diverted most of its crude exports to Baltic Sea ports?
By using Baltic ports Russia can use its logistical advantage to approach many countries that are among the top 15 oil importers such as the Netherlands, the United Kingdom, Germany and France. China and India are other big oil importers that Russia can easily approach from Siberia. However, in these regions there are competitors of Russia which share the same logistical advantages such as Kuwait and Saudi Arabia. Given these facts Russia may be inclined to extend the privilege of its unique logistic advantage to exporting crude oil to countries near the Baltic Sea region and as a result focus on these countries to export its oil. Also since in the Baltic region, there are more than two large oil importers, Russia diversifies its risks in case of future political dispute with one of its oil importers like Netherlands, Germany and United Kingdom.
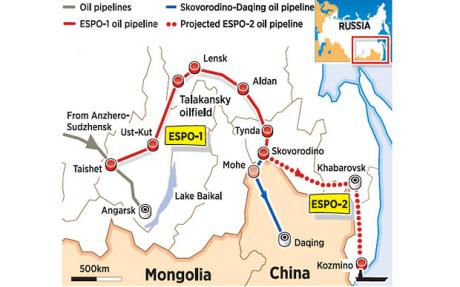
Russia-China Pipeline
Sino-Russian pipeline, expansion of ESPO-1 pipeline, from Skovordino (Russia) to Daqing (China) via Mohe (China) has been started its operations in January 1st, 2018. Due to these new extensions, China’s annual crude oil import from Russia through the pipeline can increase from 15 million tons to 30 million tons (Almost 100 million Barrels to 200 million Barrels) The project intended with cooperation between China and Russia. The pipeline has 945 kilometer length. This pipeline has annual capacity of 15 million tons.
Who can Provide This Demand?
Russia is an important strategic partner of India for many years.In 2000 they signed a “Declaration on the Russia-India strategic partnership” and in December 2010 they enhanced this agreement by signing a new agreement which is named “special and strategic partnership”. Also in 14 October 2017 Russian Rosneft signed an agreement by which Russia purchase the 49 percent of the stakes of India’s second largest private private oil Refiner Essar Oil LTD. which can help the Russia to increase its influence in Indian Crude Markets. India and Russia conveys an annual meeting since 2001 and in each of this meetings they deepen their strategic partnerships and collaboration in many areas.
China built many big projects to meet its oil demand. They built expansion of ESPO-1 pipeline between Skovorodino and Daqing in order to provide oil from Russia. Also, a pipeline across the Myanmar to China was built as to ease the transportation of oil From Middle East and Africa to China. Thus we can say that China strategically chose its potential partners to provide oil.
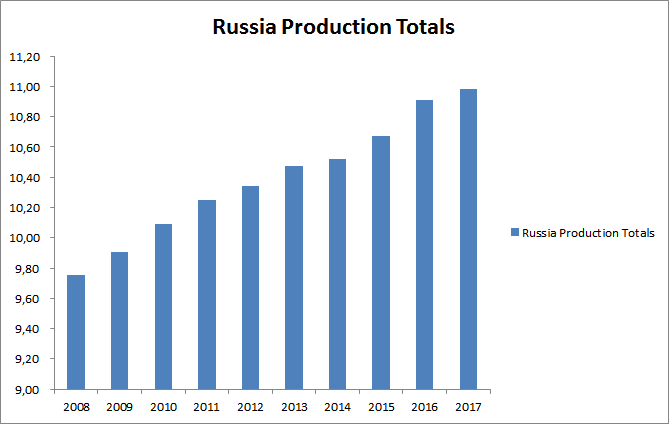
With the information mentioned above it appears that China will provide oil from both Russia and another country. In the projection of Eikon we can observe that in 2017 oil production of Russian Federation is 10.99 mmbpd and it is projected that it will decrease in the future. By our projections oil import of China will be 14.41 mmbpd in 2028 and 8.38 mmbpd for India by 2028. In this case the petrol supply from Russia to India will not meet demands of the India. So India have to find also another partner to import oil and this partner can not be Saudi Arabia because of the Russia factor. So it can meet this demand with other big and close oil producers Qatar and Kuwait.
Role of oil pipelines and on Russian oil trade
In Russia oil pipelines have been installed and controlled under the monopoly of Russian Transneft (Russian oil pipeline monopoly) of which 100% voting shares are in federal ownership. As of the beginning of 2017 Transneft operates 53,000 km of trunk oil pipelines. In 2016 85% (483.4/547.3)[7] of oil products produced in Russia were transported through these pipelines. The pipelines also connect the Asian and European markets with Russian oil fields. Through the Sino-Russian pipeline between Mohe-Daqing was constructed parallel to the first pipeline between Mohe and Daqing, Russia can transport 219 million barrels crude oil to China through the pipeline. According to our projections it is equal to 12.86 days of China’s oil consumption in 2028.
Major crude oil Trade Ports in The US
Port Corpus Christi:
Main Oil Exporter in U.S.A. Its total crude oil trade volume between 2017 and 2018 is 61,548,016 barrels. The texas state in which the Corpus Christi located has the highest oil reserves among the 48 state of the United States. Crude oil is transported to Corpus Christi via pipelines from the close regions.
South Loisuana Port:
South Louisiana is mainly importing Crude oil.Its total crude oil trade volume between 2017 and 2018 is 39,084,786 Barrels. The port located in the Mexico Gulf area.
Port of Houston:
Port of Houston is located in the Gulf of Mexico area. Its total crude oil trade volume between 2017 and 2018 is 29,943,977 barrels. Oil arrives to Houston port from different areas of Texas by pipelines.
Port of Beaumont:
Port of Beaumont is located in to Beaumont, Louisiana, Gulf of Mexico. Its total crude oil trade between 2017 and 2018 is 23,243,391.
Port Arthur:
Port Arthur located in the entrance of Sabine Lake from the Gulf of Mexico. Port Arthur is major outlet for oil.Its total crude oil trade between 2017 and 2018 is 14,118,925 barrels.
If Russia crude exports increase as increase in the imports of China in 2028 what will be the increase in crude flow in Turkish straits?
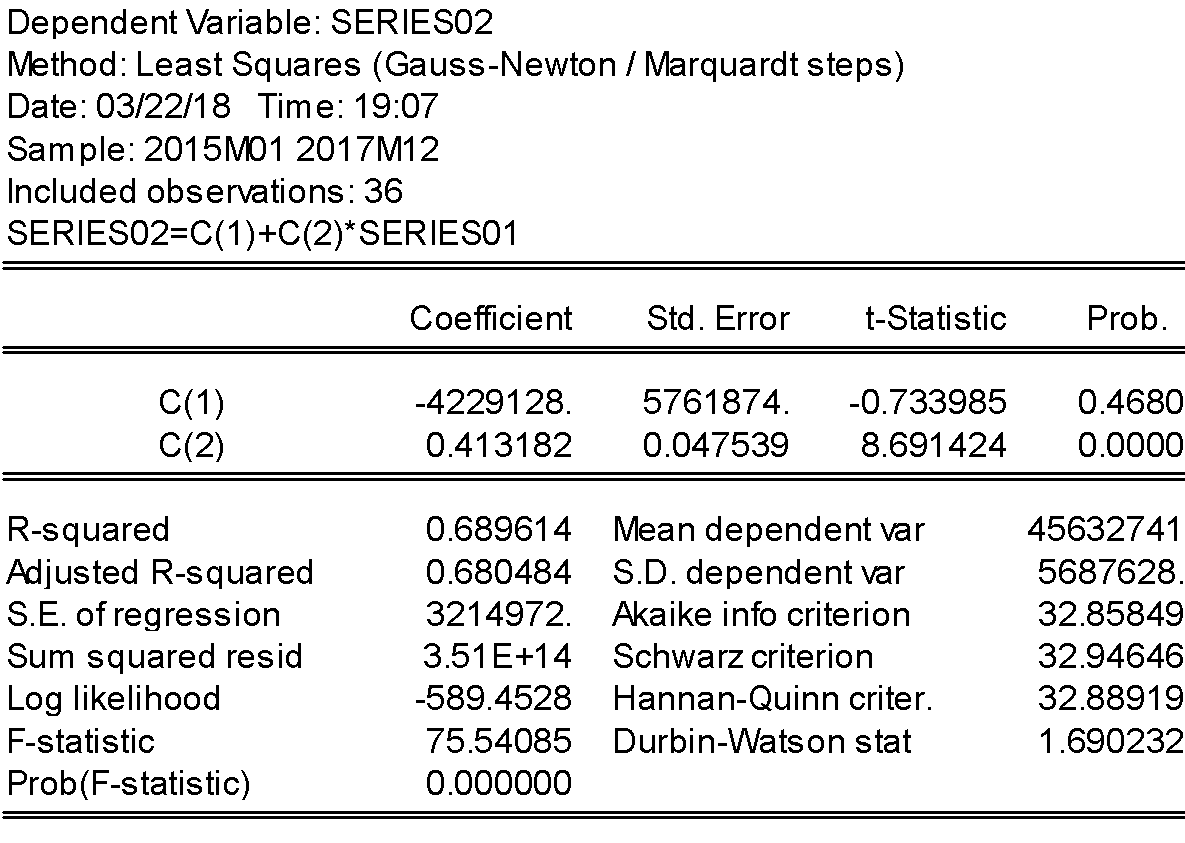
By examining the sensitivity(table 10) of Russia’s crude export from the Black Sea to the Russia’s crude export and the considering on the which percentage of crude exported from Russia across the Turkish straits we can estimate that if Russia’s crude export increase is same with the increase China’s crude import in , by 2028 the increase in the crude flow of Turkish straits will be 2,411,262 barrels
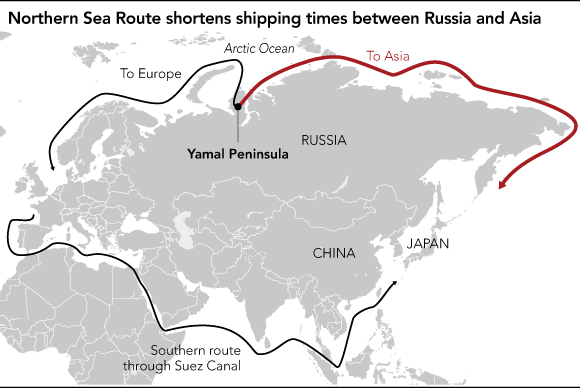
What might be routes that will be open in North Atlantic with global warming?
Due to the global warming, hence melting in glaciers of the Arctic Ocean, oil tankers may use the Northern Sea Route and Transpolar Sea Route between the Russian and Asian ports(table 1). This route will reduce the time of journey significantly. In table 12 the red line demonstrates the route of Northern Sea and Transpolar Sea Routes. The black line in the map shows the route that has already been used.
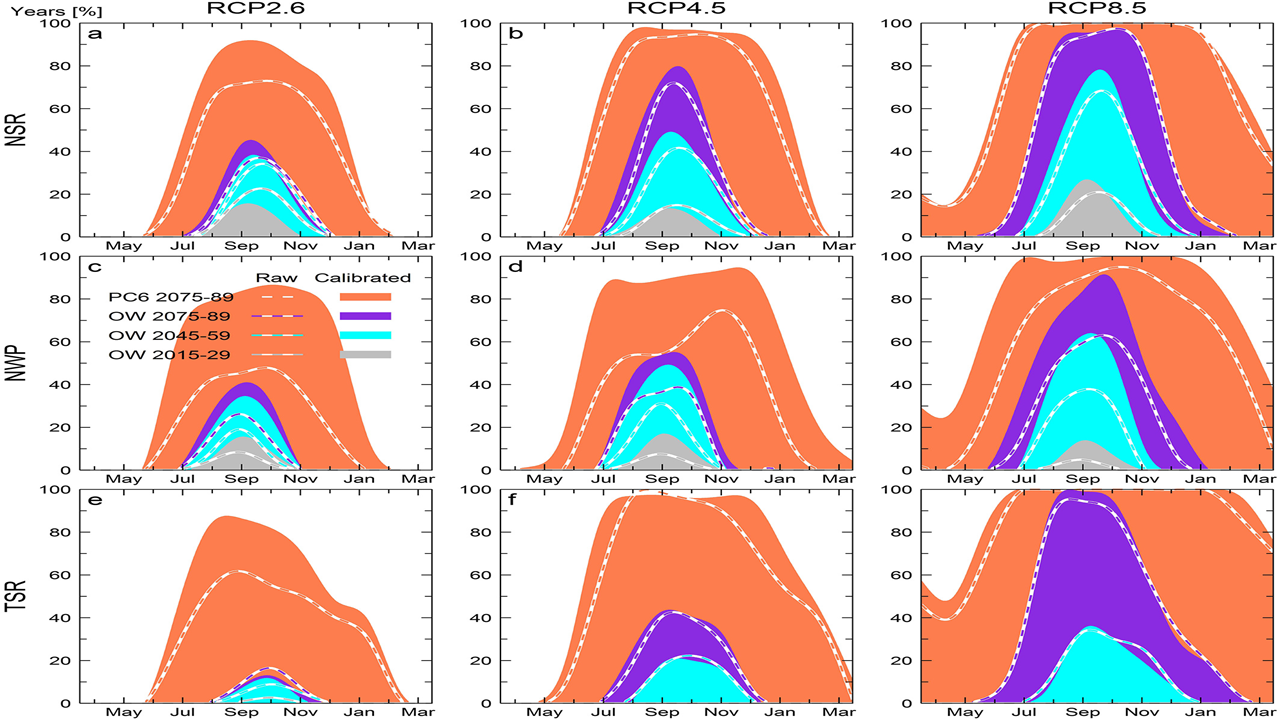
How many months per year will it be operational?
Figure in (map 1) shows the probability of being open of Northern Sea Route and Transpolar Sea Route for different carbon emission scenarios.
What kind of routes might be evaluate between Russian Export ports and Chinese import ports?
Russian major Murmansk port is in the way of Northern Sea Route and Transpolar Sea Route.
With new Chinese demand how many more ships will pass Bosphorus.?
If we consider that all ships pass through Bosphorus are Suezmax 1 more ship will pass through Bosphorus in 4.17 days and approximately 87 new ships will pass through Bosphorus. Today approximately 6212 oil tankers pass through the Bosphorus.
What will be the increase in the Russian-Chinese trade?
When we consider the percentage of Chinese import to the Russian export we can find that it will increase 0.58 million barrel per day.
Analyses for Novorossiyk
Specification of Tanker types departing from Novorosskiy:
Based on tanker data from Eikon, we estimated that from March 2017 to March 2018 approximately 24.02% of oil tankers loaded form Novorossiysk port are Suezmax. 51.52 % of them are Aframax. 3.59% of them are Panamax and 20.88% are Handymax, Handysize, Coastal tanker and other classes less than 50.000 DWT.
Specification of oil grades departing from Novorossiysk:
Using Eikon we found that from March 2107 to March 2018 approximately 83.18% oil products loading from Novorossiysk port are shipments of crude oil. 33.9% of this crude oil is Urals, 64.63% is CPC Blend and 9‰ is Siberian light. The remaining 16.82% is Fuel Oil.
Shipment capacity for oil trade at Novorossiysk Port:
Novorossiysk port has eight berth three of these berths are eligible for crude oil trade and four of them are eligible for trade of oil products. The remaining one is not used in trading activities but to support other ports in trading process.
Capacity of Novorossiysk port:
Altough we could not determine oil trade capacity of Novorossiysk port due to a lack of data from Russian authorities, we can infer from historical export volumes that crude oil trade capacity of the port is at least 1,984,000 bbl/day and fuel oil trade capacity is at least 198,000 bbl/day.
APPENDIX
2016 China Crude Imports | 2017 China Crude Imports | ||
Load Country | Total | Load Country | Total |
Saudi Arabia | 15,22% | Saudi Arabia↓ | 13,62% |
Angola | 12,02% | Angola↑ | 12,58% |
Iraq | 10,21% | Iraq↓ | 9,25% |
Oman | 9,86% | Iran↓ | 8,61% |
Iran | 8,90% | Oman↓ | 8,00% |
Russian Federation | 6,22% | Russian Federation↓ | 5,42% |
Kuwait | 4,90% | Kuwait↓ | 4,80% |
Venezuela | 4,14% | Venezuela↑ | 4,23% |
United Arab Emirates | 3,71% | Brazil↑ | 3,84% |
Brazil | 3,17% | United Kingdom↑ | 2,92% |
Uruguay | 2,53% | United Arab Emirates↓ | 2,72% |
Republic of Congo | 1,84% | Malaysia↑ | 2,64% |
United Kingdom | 1,70% | Republic of Congo↑ | 2,35% |
Indonesia | 1,62% | Uruguay↓ | 2,16% |
Sudan | 1,51% | United States↑ | 1,85% |
South Korea | 1,20% | Panama | 1,29% |
Malaysia | 1,19% | South Korea | 1,24% |
Curacao | 1,10% | Sudan | 0,93% |
Colombia | 0,99% | Singapore | 0,91% |
Ghana | 0,94% | Gabon | 0,90% |
Panama | 0,90% | Ghana | 0,88% |
Vietnam | 0,85% | Curacao | 0,80% |
Gabon | 0,80% | Indonesia | 0,78% |
Australia | 0,79% | Libya | 0,74% |
Aruba | 0,38% | Denmark | 0,70% |
Argentina | 0,34% | Equatorial Guinea | 0,58% |
Equatorial Guinea | 0,32% | Egypt | 0,47% |
Denmark | 0,31% | Australia | 0,47% |
Singapore | 0,28% | Colombia | 0,43% |
Turkey | 0,23% | Vietnam | 0,35% |
Nigeria | 0,22% | Cameroon | 0,34% |
Bahamas | 0,20% | Mexico | 0,29% |
Egypt | 0,19% | Yemen | 0,29% |
Ecuador | 0,19% | Ecuador | 0,28% |
Cameroon | 0,18% | Japan | 0,27% |
Saint Lucia | 0,16% | Argentina | 0,26% |
Mexico | 0,15% | Nigeria | 0,26% |
Qatar | 0,12% | Qatar | 0,22% |
Brunei Darussalam | 0,08% | Aruba | 0,21% |
United States | 0,08% | Turkey | 0,17% |
Libya | 0,06% | Canada | 0,17% |
Canada | 0,05% | South Africa | 0,15% |
Hong Kong | 0,04% | Virgin Islands (U.S.) | 0,11% |
Yemen | 0,04% | Algeria | 0,09% |
Thailand | 0,03% | Brunei Darussalam | 0,08% |
Malta | 0,02% | Cyprus | 0,07% |
Japan | 0,02% | Togo | 0,07% |
South Africa | 0,02% | Saint Lucia | 0,07% |
Grand Total | 100,00% | Congo-Kinshasa / Democratic Republic of Congo | 0,06% |
|
| Bonaire, Sint Eustatius and Saba | 0,05% |
|
| Bahamas | 0,04% |
|
| Thailand | 0,01% |
Data Source: Thomson Reuters Eikon; Bold=OPEC
| CHINA | INDIA | ||||
GDP * | Consumption** | Crude Import ** | GDP* | Consumption** | Import** | |
2002 | 3.979.786 | 4.395.367 | 1.391.251 | 1.921.655 | 2.222.320 | 1.652.716 |
2003 | 4.377.765 | 4.856.352 | 1.826.343 | 2.056.163 | 2.391.290 | 1.758.388 |
2004 | 4.819.919 | 5.833.153 | 2.461.644 | 2.227.476 | 2.577.815 | 1.915.030 |
2005 | 5.364.570 | 5.984.864 | 2.546.819 | 2.430.418 | 2.566.435 | 1.942.512 |
2006 | 6.045.870 | 6.467.453 | 2.909.562 | 2.656.238 | 2.873.705 | 2.210.818 |
2007 | 6.904.384 | 6.925.993 | 3.270.502 | 2.920.310 | 3.121.430 | 2.411.145 |
2008 | 7.567.205 | 7.252.462 | 3.585.347 | 3.098.305 | 3.229.503 | 2.558.303 |
2009 | 8.264.462 | 7.780.744 | 4.065.731 | 3.259.867 | 3.220.443 | 2.596.823 |
2010 | 9.127.849 | 8.832.700 | 4.795.828 | 3.622.119 | 3.269.233 | 2.755.865 |
2011 | 9.976.729 | 9.084.215 | 5.061.171 | 3.903.824 | 3.430.657 | 3.274.318 |
2012 | 10.740.203 | 9.530.209 | 5.432.933 | 4.094.438 | 3.669.786 | 3.565.042 |
2013 | 11.564.105 | 9.772.225 | 5.654.587 | 4.277.731 | 4.308.580 | 3.782.076 |
2014 | 12.415.720 | 10.337.984 | 6.179.864 | 4.488.013 | 4.498.535 | 3.777.899 |
2015 | 13.325.589 | 10.991.123 | 6.723.578 | 4.751.391 | 4.581.406 | 3.938.960 |
2016 | 14.217.032 | 11.568.626 | 7.636.448 | 5.039.874 | 4.941.441 | 4.321.534 |
2017*** | 15.099.104 | 13.214.166 | 8.508.562 | 5.340.122 | 5.235.825 | 4.578.987 |
2028 (Forecast) | 24.550.611 | 17.026.684 | 14.413.730 | 9.995.794 | 7.848.011 | 8.381.401 |
*Real GDP in million 2010 Dollars; Source: OECD
** bbl/day;Data Source: JODI
*** National Statistics Bureau for China, derived for India, figures not used in regression to avoid miscalculation
| CHINA | INDIA | ||||
LOG GDP | LOG Consumption | LOG Import | LOG GDP | LOG Consumption | LOG Import | |
2002 | 6,60 | 6,64 | 6,14 | 6,28 | 6,35 | 6,22 |
2003 | 6,64 | 6,69 | 6,26 | 6,31 | 6,38 | 6,25 |
2004 | 6,68 | 6,77 | 6,39 | 6,35 | 6,41 | 6,28 |
2005 | 6,73 | 6,78 | 6,41 | 6,39 | 6,41 | 6,29 |
2006 | 6,78 | 6,81 | 6,46 | 6,42 | 6,46 | 6,34 |
2007 | 6,84 | 6,84 | 6,51 | 6,47 | 6,49 | 6,38 |
2008 | 6,88 | 6,86 | 6,55 | 6,49 | 6,51 | 6,41 |
2009 | 6,92 | 6,89 | 6,61 | 6,51 | 6,51 | 6,41 |
2010 | 6,96 | 6,95 | 6,68 | 6,56 | 6,51 | 6,44 |
2011 | 7,00 | 6,96 | 6,70 | 6,59 | 6,54 | 6,52 |
2012 | 7,03 | 6,98 | 6,74 | 6,61 | 6,56 | 6,55 |
2013 | 7,06 | 6,99 | 6,75 | 6,63 | 6,63 | 6,58 |
2014 | 7,09 | 7,01 | 6,79 | 6,65 | 6,65 | 6,58 |
2015 | 7,12 | 7,04 | 6,83 | 6,68 | 6,66 | 6,60 |
2016 | 7,15 | 7,06 | 6,88 | 6,70 | 6,69 | 6,64 |
2017 | 7,18 | 7,12 | 6,93 | 6,73 | 6,69 | 6,65 |
2028 (est.) | 7,39 | 7,23 | 7,16 | 7,00 | 6,89 | 6,92 |
*Real GDP in million 2010 Dollars; Source: OECD
** bbl/day;Data Source: JODI
*** National Statistics Bureau for China, derived for India, figures not used in regression to avoid miscalculation
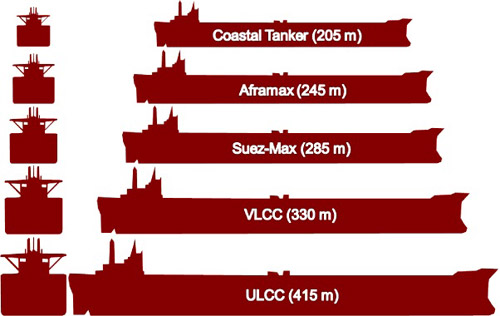
Class | Length | Beam | Draft | Overview |
Coastal Tanker | 205 m | 29 m | 16 m | Less than 50,000 DWT, mainly used for transportation of refined products (gasoline, gasoil). |
228.6m | 32.3m | 12.6m | 60,000-80,000 DWT | |
Aframax | 245 m | 34 m | 20 m | Approximately 80,000 DWT, which is the AFRA (Average Freight Rate Assessment) standard. This standard was established to standardize contract terms with well defined ship capacity. |
Suezmax | 285 m | 45 m | 23 m | Between 125,000 and 180,000 DWT, originally the maximum capacity of the Suez Canal. |
VLCC | 330 m | 55 m | 28 m | Very Large Crude Carrier. Up to around 320,000 DWT. Some can be accommodated by the expanded dimensions of the Suez Canal. The most common length is in the range of 300 to 330 meters. |
ULCC | 415 m | 63 m | 35 m | Ultra Large Crude Carrier. Capacity exceeding 320,000 DWT. The largest tankers ever built have a deadweight of over 550,000 DWT. |
Source:Turkish Shipowners’ Association
SUMMARY OUTPUT China GDP-Consumption | ||||||||
Regression Statistics | ||||||||
Multiple R | 0,9931 | |||||||
R Square | 0,9862 | |||||||
Adjusted R Square | 0,9852 | |||||||
Standard Error | 0,0157 | |||||||
Observations | 15 | |||||||
ANOVA | ||||||||
| df | SS | MS | F | Significance F | |||
Regression | 1 | 0,230661 | 0,2307 | 931,4753 | 1,74E-13 | |||
Residual | 13 | 0,003219 | 0,0002 | |||||
Total | 14 | 0,23388 |
|
|
| |||
| Coefficients | Standard Error | t Stat | P-value | Lower 95% | Upper 95% | Lower 95,0% | Upper 95,0% |
Intercept | 2,0034 | 0,1600 | 12,5227 | 0,0000 | 1,6578 | 2,3490 | 1,6578 | 2,3490 |
LOG GDP | 0,7074 | 0,0232 | 30,5201 | 0,0000 | 0,6574 | 0,7575 | 0,6574 | 0,7575 |
SUMMARY OUTPUT China GDP- Imports | ||||||||
Regression Statistics | ||||||||
Multiple R | 0,988583 | |||||||
R Square | 0,977296 | |||||||
Adjusted R Square | 0,975549 | |||||||
Standard Error | 0,033799 | |||||||
Observations | 15 | |||||||
ANOVA | ||||||||
| df | SS | MS | F | Significance F | |||
Regression | 1 | 0,639244 | 0,639244 | 559,5758 | 4,53E-12 | |||
Residual | 13 | 0,014851 | 0,001142 | |||||
Total | 14 | 0,654095 |
|
|
| |||
| Coefficients | Standard Error | t Stat | P-value | Lower 95% | Upper 95% | Lower 95,0% | Upper 95,0% |
Intercept | -1,5445 | 0,343615 | -4,49484 | 0,000603 | -2,28683 | -0,80216 | -2,28683 | -0,80216 |
LOG GDP | 1,177693 | 0,049785 | 23,65535 | 4,53E-12 | 1,070138 | 1,285248 | 1,070138 | 1,285248 |
Summary Output GDP- Consumption | |||||
Multiple R | 0,969049 | ||||
R Square | 0,939056 | ||||
Adjusted R Square | 0,933977 | ||||
Standard Error | 0,025734 | ||||
Observations | 14 | ||||
ANOVA | |||||
df | SS | MS | F | Significance F | |
Regression | 1 | 0,122451 | 0,122451 | 184,9025 | 1,19E-08 |
Residual | 12 | 0,007947 | 0,000662 | ||
Total | 13 | 0,130398 | |||
Coefficients | Standard Error | t Stat | P-value | Lower 95% | |
Intercept | 1,496629 | 0,370253 | 4,042182 | 0,001633 | 0,689917 |
Log GDP | 0,771328 | 0,056724 | 13,59789 | 1,19E-08 | 0,647737 |
SUMMARY OUTPUT India GDP-Import |
|
|
|
|
| |||
|
|
|
|
|
|
|
|
|
Regression Statistics |
|
|
|
|
|
|
| |
Multiple R | 0,991361 |
|
|
|
|
|
|
|
R Square | 0,982798 |
|
|
|
|
|
|
|
Adjusted R Square | 0,981364 |
|
|
|
|
|
|
|
Standard Error | 0,017668 |
|
|
|
|
|
|
|
Observations | 14 |
|
|
|
|
|
|
|
|
|
|
|
|
|
|
|
|
ANOVA |
|
|
|
|
|
|
|
|
| df | SS | MS | F | Significance F |
|
|
|
Regression | 1 | 0,2140 | 0,214002 | 685,5731 | 5,89E-12 |
|
|
|
Residual | 12 | 0,003746 | 0,000312 |
|
|
|
|
|
Total | 13 | 0,217748 |
|
|
|
|
|
|
|
|
|
|
|
|
|
|
|
| Coefficients | Standard Error | t Stat | P-value | Lower 95% | Upper 95% | Lower 95,0% | Upper 95,0% |
Intercept | -0,20759 | 0,254197 | -0,816 | 0,430053 | -0,76143 | 0,346262 | -0,76143 | 0,346262 |
6,283675 | 1,019687 | 0,038944 | 26,183 | 5,89E-12 | 0,934836 | 1,104539 | 0,934836 | 1,104539 |
2017 China Crude Imports by Port | ||
Ningbo and Zhoushan | 420.311.579 | |
Qingdao | 404.902.012 | |
Lanshan | 305.963.895 | |
Dalian | 195.877.360 | |
Zhanjiang | 161.249.929 | |
Quanzhou | 142.942.150 | |
Huizhou | 124.583.359 | |
Tianjin | 123.361.440 | |
Dongjiakou | 103.451.184 | |
Caofeidian | 101.925.171 | |
Shuidong | 81.301.644 | |
Bayuquan (Yingkou New Port) | 76.012.416 | |
Cezi Island | 73.525.494 | |
Yantai | 72.500.861 | |
Beilun | 65.700.895 | |
Yangpu | 60.684.538 | |
Qinzhou | 57.570.718 | |
Longkou | 45.412.978 | |
Yingkou | 22.957.104 | |
Jinzhou | 20.818.701 | |
Laizhou | 20.631.020 | |
Rizhao | 10.335.515 | |
Dongying | 9.107.582 | |
Zhoushan | 6.824.536 | |
Meizhou | 4.419.378 | |
Aoshan Oil Terminal | 3.386.501 | |
Guangzhou (incl. Huangpu and Nanhai) | 1.630.559 | |
Yangshan Port | 1.332.600 | |
Fangcheng | 1.153.373 | |
Zhenjiang | 969.825 | |
Undefined | 604.840 | |
Laizhou Sanshandao (Longkou Area) | 535.147 | |
Shandong Province | 312.893 | |
Total | 2.722.297.197 | |
Data Source: Thomson Reuters Eikon
| |
Jamnagar (Sikka) | 501.643.676 |
Vadinar | 252.801.539 |
Paradip | 197.475.774 |
Mumbai | 102.406.727 |
Mundra | 98.501.163 |
Cochin | 90.907.744 |
New Mangalore | 77.800.721 |
Visakhapatnam | 64.142.707 |
Chennai | 52.061.022 |
Mangalore | 3.895.851 |
WCI | 3.629.475 |
Sikka | 612.232 |
Hazira | 424.151 |
Bedi Bunder | 287.325 |
Grand Total | 1.446.590.105 |
2016 INDIAN CRUDE IMPORTS |
| 2017 INDIAN CRUDE IMPORTS | ||
| ||||
Load Country | Total |
| Load Country | Total |
Saudi Arabia | 19,44% |
| Iraq↑ | 18,87% |
Iraq | 17,10% |
| Saudi Arabia↓ | 17,80% |
Iran | 10,86% |
| Iran↑ | 11,73% |
Venezuela | 9,99% |
| Nigeria↓ | 8,15% |
Nigeria | 9,51% |
| United Arab Emirates↓ | 7,88% |
United Arab Emirates | 8,76% |
| Venezuela↓ | 7,40% |
Kuwait | 4,96% |
| Kuwait↑ | 5,12% |
Qatar | 2,95% |
| Angola↑ | 3,45% |
Angola | 2,64% |
| Mexico↑ | 3,00% |
Malaysia | 2,25% |
| Russian Federation↑ | 2,29% |
Mexico | 2,10% |
| Oman↑ | 1,87% |
Egypt | 1,21% |
| Brazil↑ | 1,86% |
Brazil | 1,16% |
| Malaysia | 1,85% |
Turkey | 0,86% |
| Qatar | 1,68% |
Cameroon | 0,79% |
| Egypt | 1,08% |
Equatorial Guinea | 0,77% |
| Algeria | 0,96% |
Brunei Darussalam | 0,66% |
| Turkey | 0,87% |
Bonaire | 0,55% |
| United States | 0,81% |
Algeria | 0,54% |
| Brunei Darussalam | 0,57% |
Curacao | 0,48% |
| Cameroon | 0,49% |
Indonesia | 0,42% |
| Sudan | 0,47% |
Oman | 0,26% |
| South Africa | 0,33% |
Russian Federation | 0,24% |
| Equatorial Guinea | 0,30% |
Uruguay | 0,17% |
| South Korea | 0,21% |
South Korea | 0,15% |
| Gabon | 0,21% |
Ecuador | 0,14% |
| Bonaire | 0,15% |
United States | 0,13% |
| Curacao | 0,13% |
Colombia | 0,13% |
| Ecuador | 0,12% |
Togo | 0,13% |
| Togo | 0,07% |
Republic of Congo | 0,13% |
| Canada | 0,06% |
China | 0,13% |
| Malta | 0,06% |
Singapore | 0,10% |
| Indonesia | 0,05% |
Gabon | 0,10% |
| Democratic Republic of Congo | 0,04% |
Cote DIvoire | 0,05% |
| Congo | 0,03% |
Sudan | 0,04% |
| Libya | 0,03% |
Democratic Republic of Congo | 0,04% |
| Grand Total | 100,00% |
Australia | 0,03% |
|
|
|
Cayman Islands | 0,02% |
|
|
|
Ukraine | 0,01% |
|
|
|
Grand Total | 100,00% |
|
|
|
Data Source:Thomson Reuters Eikon; Bold=OPEC
2015 | |
Discharge Country | Total |
Unknown | 0,04% |
Bahamas | 0,07% |
Belgium | 1,21% |
Bulgaria | 2,47% |
Canada | 0,14% |
China | 9,54% |
Croatia | 1,82% |
Curacao | 0,26% |
Cyprus | 0,04% |
Denmark | 1,25% |
Egypt | 0,53% |
Finland | 3,03% |
France (Northern) | 2,67% |
France (Southern) | 3,59% |
Germany | 1,84% |
Gibraltar | 0,06% |
Greece | 3,81% |
India | 0,41% |
Israel | 0,42% |
Italy | 13,92% |
Japan | 8,40% |
Lithuania | 2,78% |
Malaysia | 0,06% |
Malta | 0,25% |
Morocco | 0,32% |
Netherlands | 11,38% |
New Zealand | 0,39% |
Norway | 2,24% |
Philippines | 0,45% |
Poland | 2,77% |
Portugal | 1,15% |
Romania | 3,01% |
Russian Federation | 0,29% |
Singapore | 0,27% |
South Korea | 8,11% |
Spain | 3,26% |
Sweden | 4,20% |
Taiwan | 0,16% |
Thailand | 0,28% |
Trinidad and Tobago | 0,35% |
Turkey | 1,52% |
Ukraine | 0,05% |
United Kingdom | 0,17% |
United States | 0,96% |
Vietnam | 0,06% |
Grand Total | 100,00% |
Grand Total as Barrels | 1.314.648.020 |
Source: Reuters
2016 | |
Discharge Country | Total |
Bahamas | 0,04% |
Belgium | 1,03% |
Bonaire, Sint Eustatius and Saba | 0,05% |
Brazil | 0,05% |
Bulgaria | 2,24% |
Canada | 0,38% |
China | 10,77% |
Colombia | 0,13% |
Croatia | 1,58% |
Cuba | 0,04% |
Denmark | 1,11% |
Egypt | 0,47% |
Finland | 3,90% |
France (Northern) | 2,73% |
France (Southern) | 4,03% |
Germany | 2,48% |
Greece | 3,10% |
India | 0,25% |
Indonesia | 0,04% |
Israel | 0,28% |
Italy | 13,82% |
Japan | 4,83% |
Lithuania | 3,53% |
Malaysia | 0,58% |
Malta | 0,24% |
Netherlands | 15,48% |
New Zealand | 0,09% |
Norway | 1,17% |
Philippines | 0,18% |
Poland | 1,50% |
Portugal | 2,00% |
Romania | 3,30% |
Russian Federation | 0,70% |
Singapore | 0,33% |
South Korea | 6,00% |
Spain | 3,78% |
Sweden | 3,53% |
Thailand | 0,32% |
Trinidad and Tobago | 0,76% |
Turkey | 1,83% |
Ukraine | 0,17% |
United Kingdom | 0,87% |
United States | 0,29% |
Grand Total | 100,00% |
Grand Total as Barrels | 1.452.419.848 |
Source: Reuters
2017 | |
Discharge Country | Total |
Unknown | 0,04% |
Bahamas | 0,08% |
Belgium | 1,95% |
Bulgaria | 2,19% |
Canada | 0,20% |
China | 9,50% |
Colombia | 0,36% |
Croatia | 1,53% |
Cuba | 0,05% |
Cyprus | 0,06% |
Denmark | 1,47% |
Egypt | 0,64% |
Estonia | 0,02% |
Finland | 4,43% |
France (Northern) | 5,22% |
France (Southern) | 2,84% |
Germany | 2,76% |
Gibraltar | 0,04% |
Greece | 1,97% |
India | 2,24% |
Israel | 0,31% |
Italy | 11,68% |
Japan | 3,96% |
Lithuania | 3,97% |
Malaysia | 0,43% |
Malta | 0,74% |
Netherlands | 15,51% |
New Zealand | 0,12% |
Norway | 0,08% |
Philippines | 0,05% |
Poland | 2,01% |
Portugal | 2,10% |
Romania | 2,88% |
Russian Federation | 0,45% |
Saudi Arabia | 0,04% |
Singapore | 0,45% |
South Korea | 6,31% |
Spain | 3,05% |
Sweden | 2,96% |
Thailand | 0,39% |
Trinidad and Tobago | 0,57% |
Turkey | 1,16% |
United Kingdom | 2,47% |
United States | 0,71% |
Venezuela | 0,02% |
Grand Total | 100,00% |
Grand Total as Barrels | 1.553.999.223 |
Source: Reuters
Source: Eikon; million barrels per day.
2008 | 2009 | 2010 | 2011 | 2012 | 2013 | 2014 | 2015 | 2016 | 2017 | 2028* |
9,75 | 9,90 | 10,09 | 10,25 | 10,34 | 10,47 | 10,52 | 10,67 | 10,91 | 10,98 | 12,29 |
Source: Eikon; *Forecast; million barrels per day.
Source: IEA; million barrels per day.
Source: IEA; million barrels per day.
Load Country | Discharge Country | Grade | API | Arrival Date To | Total | % of Grand Total |
Russian Federation | China | ESPO blend Total | 35,6 | 2017 | 128.520.629,22 | 88,37% |
Sakhalin Blend Total | 45,5 | 2017 | 9.305.600,00 | 6,40% | ||
Sokol (Sakhalin I) Total | 36 | 2017 | 608.751,69 | 0,42% | ||
Urals Total | 31,5 | 2017 | 6.999.933,33 | 4,81% | ||
Average API | 37,15 | 2017 Total | 145.434.914,24 | 100% | ||
Load Country | Discharge Country | Grade | API | Arrival Date To | Total | % of Grand Total |
Russian Federation | China | ESPO blend Total | 35,6 | 2018 | 18.766.074,48 | 94,16% |
Sakhalin Blend Total | 45,5 | 2018 | 1.163.200,00 | 5,84% | ||
Sokol (Sakhalin I) Total | 36 | 2018 | 0,00 | 0,00% | ||
Urals Total | 31,5 | 2018 | 0,00 | 0,00% | ||
Average API | 37,15 | 2018 Total | 19.929.274,48 | 100% | ||
Load Country | Discharge Country | Grade |
| Arrival Date To | Total | % of Grand Total |
Saudi Arabia | China | Arab Crude | 32 | 2017 | 323.852.026,87 | 95,93% |
Arab Light | 33,4 | 2017 | 6.442.029,46 | 1,91% | ||
Arab Medium | 30,2 | 2017 | 973.264,88 | 0,29% | ||
Crude Oil(AM*) |
| 2017 | 6.336.738,36 | 1,88% | ||
Average API | 31,87 | 2017 Total | 337.604.059,57 | 100% | ||
Load Country | Discharge Country | Grade | API | Arrival Date To | Total | % of Grand Total |
Saudi Arabia | China | Arab Crude | 32 | 2018 | 40.761.648,75 | 100,00% |
Arab Light | 33,4 | 2018 | 0,00 | 0,00% | ||
Arab Medium | 30,2 | 2018 | 0,00 | 0,00% | ||
Crude Oil |
| 2018 | 0,00 | 0,00% | ||
Average API | 31,87 | 2018 Total | 40.761.648,75 | 100% | ||
Load Country | Discharge Country | Grade | API | Arrival Date To | Total | % of Grand Total |
Angola | China | Cabaca Total |
| 2017 | 4.109.463,01 | 1,27% |
Cabinda Total | 32,4 | 2017 | 948.774,36 | 0,29% | ||
Dalia Total | 23,6 | 2017 | 32.740.520,46 | 10,12% | ||
Clov Total | 32,4 | 2017 | 16.560.536,67 | 5,12% | ||
Gimboa Total | 23,6 | 2017 | 896.770,90 | 0,28% | ||
Girassol Total | 30,1 | 2017 | 16.716.245,27 | 5,17% | ||
Hungo Blend Total | 28,7 | 2017 | 22.160.280,71 | 6,85% | ||
Kissanje Blend Total | 31,3 | 2017 | 14.785.755,74 | 4,57% | ||
Mondo Total | 29,8 | 2017 | 20.540.609,41 | 6,35% | ||
Nemba Total | 40,9 | 2017 | 70.292.004,41 | 21,73% | ||
Palanca Total | 37,8 | 2017 | 2.879.630,46 | 0,89% | ||
Pazflor Total | 25,6 | 2017 | 21.159.927,92 | 6,54% | ||
Plutonio Total | 33,2 | 2017 | 22.637.337,67 | 7,00% | ||
Sangos Total | 30 | 2017 | 20.021.951,43 | 6,19% | ||
Saturno Total | 27,6 | 2017 | 50.118.312,50 | 15,50% | ||
Saxi Batuque Blend Total | 34,4 | 2017 | 6.849.184,03 | 2,12% | ||
Average API | 30,76 | 2017 Total | 323.417.304,95 | 100,00% | ||
Load Country | Discharge Country | Grade | API | Arrival Date To | Total | % of Grand Total |
Iraq | China | Basrah Heavy Total | 23,7 | 2017 | 30.457.443,80 | 13,88% |
Basrah Light Total | 29,7 | 2017 | 189.023.183,82 | 86,12% | ||
Average API | 26,7 | 2017 Total | 219.480.627,62 | 100,00% | ||
Load Country | Discharge Country | Grade | API | Arrival Date To | Total | % of Grand Total |
Iran | China | Condensate Total |
| 2017 | 8.368.052,32 | 4,56% |
Crude Oil Total(IL*) |
| 2017 | 1.837.500,00 | 1,00% | ||
Foroozan Total | 29,7 | 2017 | 486.736,43 | 0,27% | ||
Iranian Heavy Total | 29,5 | 2017 | 31.337.505,83 | 17,09% | ||
Iranian Light Total | 33,4 | 2017 | 11.292.579,50 | 6,16% | ||
Iranian Light/Heavy Total | 31,45 | 2017 | 101.879.111,48 | 55,55% | ||
Lavan Blend Total | 34,2 | 2017 | 6.415.453,24 | 3,50% | ||
Sirri Total | 33,4 | 2017 | 8.652.076,82 | 4,72% | ||
Soroosh (Cyrus) Total | 19 | 2017 | 13.117.470,03 | 7,15% | ||
Average API | 30,09 | 2017 Total | 183.386.485,65 | 100,00% | ||
Load Country | Discharge Country | Grade | API | Arrival Date To | Total | % of Grand Total |
Oman | China | Oman Export Total | 34 | 2017 | 197.236.615,83 | 100,00% |
Average API | 34 | 2017 Total | 197.236.615,83 | 100,00% | ||
|
|
| Total Average API |
| Total Import 2017 | Grand Total of All |
|
|
| 31,76 |
| 1.406.560.007,9 | 2.444.152.388,88 |
Source: Reuters; APIs are gathered from various sources such as OPEC, EIA, IEA, BP etc. ; blank rows are not included in the mean calculations; million barrels per day, AM: Arabian Medium, IL: Iranian Light.
INDIAN IMPORTS | |
Arab Crude | 17,44% |
Basrah Light | 11,64% |
Iranian Light/Heavy | 7,19% |
Morichal | 6,37% |
Crude Oil | 6,14% |
Basrah Heavy | 5,69% |
Kuwait Blend | 5,12% |
Maya | 2,74% |
Murban | 2,30% |
Agbami | 2,22% |
Das | 2,04% |
Oman Export | 1,94% |
Iranian Heavy | 1,89% |
Qua Iboe | 1,83% |
Upper Zakum | 1,78% |
Basrah Blend | 1,42% |
Urals | 1,25% |
CPC Blend | 1,03% |
Al Shaheen | 0,99% |
Akpo Blend | 0,91% |
Clov | 0,84% |
Saharan Blend | 0,82% |
Azeri BTC | 0,81% |
Nemba | 0,79% |
Soroosh (Cyrus) | 0,78% |
Kimanis | 0,72% |
Labuan | 0,68% |
Girassol | 0,67% |
ERHA | 0,56% |
Iranian Light | 0,53% |
Bonny Light | 0,53% |
Champion | 0,53% |
Bonga | 0,53% |
Zuata 30/Hamaca Blend | 0,52% |
Condensate | 0,52% |
Dar Blend | 0,47% |
NFC II | 0,47% |
Foroozan | 0,46% |
Usan | 0,45% |
Dalia | 0,44% |
Kissanje Blend | 0,38% |
Isthmus | 0,26% |
Amenam Blend | 0,26% |
Kole-Lokele | 0,26% |
Okwuibome | 0,25% |
Lower Zakum | 0,25% |
Doba | 0,24% |
Forcados Blend | 0,23% |
South Pars Crude Oil | 0,23% |
West Texas Intermediate | 0,21% |
Rabi Light/Mandji | 0,21% |
Arab Light | 0,20% |
Escravos | 0,20% |
Aseng | 0,16% |
Eagleford | 0,15% |
Source: Reuters
RUSSIAN EXPORTS | |
Urals | 48,64% |
CPC Blend | 24,29% |
ESPO blend | 12,10% |
Sokol (Sakhalin I) | 4,35% |
Arco | 3,33% |
Arco/Novy Port | 3,26% |
Sakhalin Blend | 2,27% |
Crude Oil | 0,63% |
Varandey | 0,52% |
Siberian Light | 0,33% |
Urals (REBCO) | 0,09% |
Condensate | 0,06% |
Novy Port | 0,05% |
Kashagan | 0,04% |
Minas (Sumatran Light) | 0,02% |
Peschanoozerskoye | 0,01% |
Grand Total | 100,00% |
Source: Reuters
Regression Outputs 3: Sensitivity of Russian crude export from Black sea to the Russian Crude export
Series01: Russian Crude export
Series02: Russsian Crude export from Black Sea
Oil Demand By Product (mmbpd) | Percentage | 2030 IEA | Adjusted |
Ethane | 1,4% | 0,1 | 0,15 |
LPG | 15,7% | 1,1 | 1,67 |
Naphtha | 7,1% | 0,5 | 0,76 |
Motor Gasoline | 14,3% | 1 | 1,52 |
Kerosene | 1,4% | 0,1 | 0,15 |
Diesel | 37,1% | 2,6 | 3,94 |
Fuel Oil | 2,9% | 0,2 | 0,30 |
Other Products | 20,0% | 1,4 | 2,12 |
Total | 100,0% | 7 | 10,62 |
Source: Key Energy Statistics 2016, Berkeley Lab
Source: IEA
Source: Unearthed, Greenpeace
Source: Key Energy Statistics 2016, Berkeley Lab
Load Country | Load Port | Discharge Country | Arrival Date | Total Volume |
Russia | De Kastri | China | 2017 | 608.751,69 |
Kozmino | China | 2017 | 128.520.629,22 | |
2018 | 29.114.319,94 | |||
Novorossiysk | China | 2017 | 6.999.933,33 | |
Sakhalin Island(Prigorodnoye) | China | 2017 | 9.305.600,00 | |
Sakhalin Island(Prigorodnoye) | 2018 | 1.163.200,00 | ||
Total Volume 2017 | 145.434.914,24 | |||
Total Volume 2018 | 30.277.519,94 |
Load Port | Total |
(Blank) | 0,05% |
Arctic Gate Terminal (Vorota Arktiki-Novy Port) | 0,05% |
Arkhangelsk (Archangel) | 0,01% |
Arkhangelsk (Archangel) Area | 0,01% |
Articneft Terminal (Kolguyev Island) | 0,01% |
Baltiysk (Kaliningrad Area) | 0,01% |
De Kastri | 5,25% |
Kaliningrad | 0,03% |
Kavkaz | 0,03% |
Kozmino | 14,21% |
Murmansk | 2,18% |
Novoportovskoye Oilfield (Ob Bay) | 0,00% |
Novorossiysk | 38,00% |
Prigorodnoye (Sakhalin Island) | 2,62% |
Primorsk | 20,08% |
Prirazlomnaya Platform (Varandey) | 0,15% |
Slavyanka | 0,01% |
St Petersburg | 0,01% |
Taman | 0,03% |
Umba FSO | 1,73% |
Ust-Luga | 14,16% |
Vanino | 0,03% |
Varandey | 1,37% |
Vyborg | 0,02% |
Grand Total | 100,00% |
Exports to China and India by Russian Port | |||
Discharge Country | Load Port | As percentage of China + India | Barrels |
China | De Kastri | 0,12% | 608.752 |
Kozmino | 81,66% | 408.860.601 | |
Novorossiysk | 2,62% | 13.102.807 | |
Prigorodnoye | 6,64% | 33.221.173 | |
China Total | 91,04% | 455.793.332 | |
India | Novorossiysk | 8,96% | 44.863.898 |
India Total | 8,96% | 44.863.898 | |
Sum of China and India | 100,00% | 500.657.230 | |
Sum of Volume |
|
|
Load Port | Discharge Country | Total |
Unknown |
| 0,05% |
Arctic Gate Terminal (Vorota Arktiki-Novy Port) | 0,05% | |
Arkhangelsk (Archangel) |
| 0,01% |
Arkhangelsk (Archangel) Area |
| 0,01% |
Articneft Terminal (Kolguyev Island) | 0,01% | |
Baltiysk (Kaliningrad Area) |
| 0,01% |
De Kastri |
| 0,04% |
| China | 0,01% |
| Indonesia | 0,01% |
| Japan | 1,38% |
| Singapore | 0,01% |
| South Korea | 3,76% |
| Thailand | 0,03% |
De Kastri Total |
| 5,25% |
Kaliningrad |
| 0,03% |
Kavkaz |
| 0,03% |
Kozmino |
| 0,03% |
| China | 8,87% |
| Japan | 2,58% |
| Malaysia | 0,33% |
| New Zealand | 0,18% |
| Philippines | 0,20% |
| Singapore | 0,28% |
| South Korea | 1,16% |
| Taiwan | 0,03% |
| Thailand | 0,27% |
| United States | 0,25% |
| Vietnam | 0,02% |
Kozmino Total |
| 14,21% |
Murmansk |
| 0,10% |
| Colombia | 0,17% |
| Denmark | 0,02% |
| France (Northern) | 0,27% |
| France (Southern) | 0,02% |
| Germany | 0,19% |
| Italy | 0,01% |
| Netherlands | 0,66% |
| Russian Federation | 0,01% |
| Spain | 0,04% |
| Trinidad and Tobago | 0,35% |
| United Kingdom | 0,33% |
| United States | 0,01% |
Murmansk Total |
| 2,18% |
Novoportovskoye Oilfield (Ob Bay) |
| 0,00% |
Novorossiysk |
| 0,30% |
| Bahamas | 0,03% |
| Belgium | 0,01% |
| Bulgaria | 2,23% |
| Canada | 0,17% |
| China | 0,28% |
| Croatia | 1,36% |
| Cuba | 0,01% |
| Cyprus | 0,03% |
| Egypt | 0,57% |
| France (Northern) | 1,31% |
| France (Southern) | 3,24% |
| Gibraltar | 0,01% |
| Greece | 2,62% |
| India | 0,97% |
| Israel | 0,32% |
| Italy | 11,00% |
| Japan | 0,54% |
| Lithuania | 0,19% |
| Malaysia | 0,04% |
| Malta | 0,35% |
| Netherlands | 3,53% |
| Norway | 0,00% |
| Poland | 0,13% |
| Portugal | 1,07% |
| Romania | 3,08% |
| Singapore | 0,06% |
| South Korea | 0,97% |
| Spain | 1,99% |
| Turkey | 1,36% |
| Ukraine | 0,07% |
| United Arab Emirates | 0,02% |
| United Kingdom | 0,07% |
| United States | 0,04% |
Novorossiysk Total |
| 38,00% |
Prigorodnoye (Sakhalin Island) |
| 0,06% |
| China | 0,72% |
| Japan | 0,99% |
| South Korea | 0,85% |
Prigorodnoye (Sakhalin Island) Total | 2,62% | |
Primorsk |
| 0,08% |
| Bahamas | 0,03% |
| Belgium | 1,16% |
| Brazil | 0,02% |
| Canada | 0,03% |
| Croatia | 0,13% |
| Cuba | 0,02% |
| Curacao | 0,11% |
| Denmark | 0,33% |
| Finland | 2,97% |
| France (Northern) | 1,02% |
| France (Southern) | 0,11% |
| Germany | 1,07% |
| Gibraltar | 0,02% |
| Greece | 0,14% |
| Italy | 0,91% |
| Lithuania | 1,52% |
| Morocco | 0,03% |
| Netherlands | 6,13% |
| Poland | 0,88% |
| Portugal | 0,57% |
| Romania | 0,04% |
| Spain | 0,64% |
| Sweden | 1,55% |
| Thailand | 0,02% |
| Trinidad and Tobago | 0,23% |
| Turkey | 0,04% |
| United Kingdom | 0,26% |
| United States | 0,03% |
Primorsk Total |
| 20,08% |
Prirazlomnaya Platform (Varandey) | 0,15% | |
Slavyanka |
| 0,01% |
St Petersburg |
| 0,01% |
Taman |
| 0,03% |
Umba FSO |
| 1,73% |
Ust-Luga |
| 0,03% |
| Bahamas | 0,02% |
| Belgium | 0,22% |
| Bonaire, Sint Eustatius and Saba | 0,02% |
| Canada | 0,03% |
| Croatia | 0,05% |
| Denmark | 0,69% |
| Estonia | 0,01% |
| Finland | 0,87% |
| France (Northern) | 0,86% |
| France (Southern) | 0,04% |
| Germany | 1,13% |
| Gibraltar | 0,02% |
| Greece | 0,11% |
| Italy | 0,87% |
| Lithuania | 1,78% |
| Malta | 0,05% |
| Morocco | 0,06% |
| Netherlands | 2,82% |
| Norway | 0,01% |
| Poland | 1,13% |
| Portugal | 0,16% |
| Singapore | 0,03% |
| Spain | 0,63% |
| Sweden | 1,94% |
| Taiwan | 0,01% |
| Turkey | 0,05% |
| United Kingdom | 0,26% |
| United States | 0,27% |
| Venezuela | 0,01% |
Ust-Luga Total |
| 14,16% |
Vanino |
| 0,03% |
Varandey |
| 1,37% |
Vyborg |
| 0,02% |
Vyborg Total |
| 0,02% |
Grand Total |
| 100,00% |
Essar Oil's Vadinar Refinery | Product Slate | ||
Capacity | 20 MTPA (2nd largest single location refinery in India) | The below table provides the product slate of the company for FY13. | |
405,000 barrels per day | Product Slate (%) |
| |
Complexity | 11,8 | LPG | 4.3% |
Location Advantages | Vadinar, Gujarat, a natural all-weather, deep-draft port that can accommodate very large crude carriers (VLCCs). The Vadinar port area receives almost 70 per cent of India's crude oil imports. | NAPTHA | 4.3% |
Location on the west coast of India provides efficient access to indigenous crudes and Persian Gulf-based crudes plus high-growth refined product export markets. | MS/REFORMATE | 15.5% | |
Capex | USD 5.31 billion Capex per bbl.: USD 13,152 | LIGHT DISTILLATE | 24.1% |
Operating Cost | USD 2.8 per bbl. | ATF | 0.1% |
Raw Materials | Capability to process ~85% of heavy/ ultra-heavy crudes & produce Euro IV/V grades of products | SKO | 3.0% |
Product Slate | LPG, Naphtha, Light Diesel Oil, ATF, Kerosene, Gasoline, Gasoil, VGO. | HSD | 47.4% |
85% production comprises of high margin light and middle distillates. | VGO | 9.0% | |
GRMs | USD 7.96/bbl. (For FY13) | MIDDLE DISTILLATE | 59.5% |
| FURNANCE OIL | 5.5% | |
BITUMEN | 1.0% | ||
SULPHUR | 1.1% | ||
Petcoke | 8.9% | ||
HEAVY DISTILLATE | 16.5% | ||
TOTAL PRODUCTS | 100.0% | ||
Source: Essaroil.co.in; two tables combined for simplicity.
Chokepoint | 2011 | 2012 | 2013 | 2014 | 2015 | 2016 |
Strait of Hormuz | 17 | 16,8 | 16,6 | 16,9 | 17 | 18,5 |
Strait of Malacca | 14,5 | 15,1 | 15,4 | 15,5 | 15,5 | 16 |
Suez Canal and SUMED Pipeline | 3,8 | 4,5 | 4,6 | 5,2 | 5,4 | 5,5 |
Bab el-Mandab | 3,3 | 3,6 | 3,8 | 4,3 | 4,7 | 4,8 |
Danish Straits | 3 | 3,3 | 3,1 | 3 | 3,2 | 3,2 |
Turkish Straits | 2,9 | 2,7 | 2,6 | 2,6 | 2,4 | 2,4 |
Panama Canal | 0,8 | 0,8 | 0,8 | 0,9 | 1 | 0,9 |
Scenario | Assumptions | Increase by 2028 (bbl/day) |
Good | Russia's new investments continue and increase, leading India to source the equivalent of Essar oil refinery's capacity from Russia. | 405,000 |
Base | Russia maintains its market share independent of investments. Investments lead to India sourcing the equivalent of 50% of Essar oil refinery's throughput. | 294,500 |
Bad | Russia's investments have no significant impact leading Russia to maintain it's current market share. | 92,500 |
Port | Area | Percentage of Total Maritime Exports |
Novorossiysk | Black Sea | 38,00% |
Primorsk | Baltic | 20,08% |
Kozmino | Siberia | 14,21% |
Ust-Luga | Baltic | 14,16% |
De Kastri | Siberia | 5,25% |
Chinese Port | Novorossiysk Distance (nm) | Kozmino Distance (nm) |
Dalian | 10426 | 1334 |
Qingdao | 10209 | 1230 |
Longkou | 10449 | 1359 |
Rizhao | 10061 | 1216 |
Laizhou | 10330 | 1359 |
China Demand Forecast |
| 2020 | 2025 | 2030 | 2035 | 2040 |
OPEC | 13,2 | 14,5 | 15,7 | 16,8 | 17,8 | |
BP | 19 | |||||
IEA | 12,5 | 13,0 | 14,7 | 16,5 | ||
EIA | 13,1 | 16,9 | 20 | |||
Gülbekyan/Simple GDP Reg | 13,5 | 15,7 | 17,9 | 20,1 | 22,5 | |
China Supply Forecast |
| 2020 | 2025 | 2030 | 2035 | 2040 |
BP | 5 | 5 | 5 | 5 | ||
EIA | 5,1 | 5,5 | 5,7 | |||
China Implied Deficit/Import Forecast | 2020 | 2025 | 2030 | 2035 | 2040 | |
BP (implied deficit) | 14 | |||||
EIA (implied deficit) | 8 | 11,4 | ||||
Gülbekyan/Simple GDP Reg | 9,81 | 12,66 | 15,64 | 19,06 | 22,98 | |
India Demand Forecast |
| 2020 | 2025 | 2030 | 2035 | 2040 |
OPEC | 5,1 | 6,4 | 7,7 | 9,1 | 10,3 | |
BP | 9,2 | |||||
IEA | 4,5 | 5,8 | 7,6 | |||
EIA (All liquids) | 5 | 5,4 | 6,1 | 7,1 | 8,3 | |
Gülbekyan/Simple GDP Reg | 5,53 | 6,89 | 8,54 | 10,45 | 12,54 | |
India Supply Forecast |
| 2020 | 2025 | 2030 | 2035 | 2040 |
BP |
|
|
|
| 0,9 |
|
IEA |
|
| 0,6 | 0,4 | 0,4 |
|
India Import Forecast |
| 2020 | 2025 | 2030 | 2035 | 2040 |
BP (implied deficit) | 8,3 | |||||
IEA |
| 3,7 | 5,4 | 7,2 | ||
Gülbekyan/Simple GDP Reg | 5,31 | 7,07 | 9,36 | 12,18 | 15,46 |
Route | 03/17-03/18 | Per Day | |
Kozmino-China (ESPO blend) | 132,616,794 | 363,334 | |
Prigorodniye- China (Sakhalin Blend) | 9,305,600 | 25,495 | |
Novorossiysk- China (Ural Grade) | 6,999,933 | 19,178 | |
Other | 608,752 | 1,668 | |
Total Maritime | 149,531,079 | 409,674 | |
ESPO pipeline exports | 110,700,000 | 303,288 | |
Total | 260,231,079 | 712,962 |
Number of berth | Length, m | Projected depths, m | Guaranteed depths, m | Specialization | Tanker type eligible for this berth |
1 | 490,0 | 24,0 | 23,4 | oil | ULCC |
2 | 320,3 | 14,4 | 13,8 | oil | Suezmax |
3 | 227,5 | 11,3 | 10,7 | oil | Coastal tanker |
4 | 148,0 | 4,4 | 3,8 | auxiliary | - |
5 | 170,0 | 9,6 | 9,0 | oil products | - |
6 | 228,0 | 13,3 | 12,7 | oil products | Coastal tanker |
7 | 228,0 | 13,3 | 12,7 | oil products | Coastal tanker |
8 | 170,0 | 9,7 | 9,1 | oil products | - |
Bbl/Year | Bbl/Day | |
Outflow | 7.165.988.557 | 19.619.407 |
Inflow | 338.609.971 | 927.064 |
Intra | 301.457.349 | 825.345 |
Total Hormuz Traffic | 6.901.683.830 | 18.895.781 |
Bbl/Year | Bbl/day | |
Outflow | 592.658.457 | 1.622.610 |
Inflow | 269.573.623 | 738.052 |
Intra | 175.692.889 | 481.021 |
Baltic Traffic | 510.846.302 | 1.398.621 |
Black Sea | Bbl/Year | Bbl/day |
Outflow | 649.673.808 | 1.778.710 |
Inflow | 59.557.782 | 163.060 |
Inter | 38.093.705 | 104.295 |
Black Sea Traffic | 633.044.180 | 1.733.181 |
[1]* This page is prepared by Burak Sezer Coşkun, Giray Uğurlu, and Berkay Büyükdoğan as a part of ECON 318 at Bilkent University. This page has reached its final stage at May 1, 2018. Due to the time limit, our conclusions are still tentative with the bold assumptions that we had to made. For all the information gathered here that are from external sources, we try to give the references as much as we can as a hyperlink. We thank the staff of TSKB for their valuable suggestions and guidance.
[2] https://energy.economictimes.indiatimes.com/news/oil-and-gas/indias-crude-oil-production-flat-in-september-import-bill-rises-21-per-cent/61492710
[3] https://www.lloydslistintelligence.com/llint/tankers/index.htm#
[4] National Defense University, “Chokepoints: Maritime Economic Concerns in Southeast Asia”, Institute for National Strategic Studies (1996), p. 2
[5] National Defense University, 1996. “Chokepoints: Maritime Economic Concerns in Southeast Asia”, Institute for National Strategic Studies, pp. 80-81
[6] https://www.osti.gov/servlets/purl/1242209
[7] The unit is million tons
[8] Turkish Shipowners’ Association
[10] source: The Globe Post Turkey
http://turkey.theglobepost.com/canal-istanbul-turkey/
[11] https://geopoliticalfutures.com/major-choke-points-persian-gulf-east-asia/
[12] https://geopoliticalfutures.com/major-choke-points-persian-gulf-east-asia/